|
Download Data (XLS File) |
|
||||||||
|
||||||||
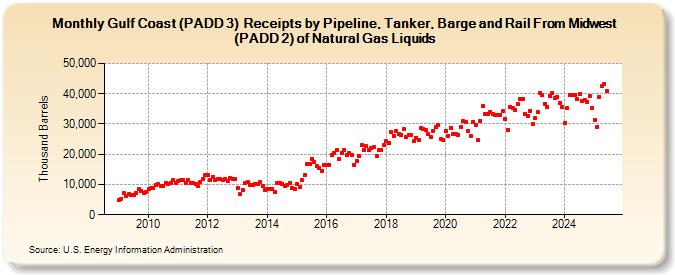
| Gulf Coast (PADD 3) Receipts by Pipeline, Tanker, Barge and Rail From Midwest (PADD 2) of Natural Gas Liquids (Thousand Barrels) | ||||||||
| Year | Jan | Feb | Mar | Apr | May | Jun | Jul | Aug | Sep | Oct | Nov | Dec |
|---|---|---|---|---|---|---|---|---|---|---|---|---|
| 2009 | 4,734 | 5,252 | 7,105 | 6,117 | 6,688 | 6,474 | 6,413 | 7,210 | 8,414 | 7,694 | 7,265 | 7,524 |
| 2010 | 8,383 | 8,725 | 8,984 | 9,917 | 10,004 | 9,598 | 9,524 | 10,557 | 10,166 | 10,548 | 11,499 | 10,616 |
| 2011 | 11,122 | 11,443 | 11,483 | 10,325 | 11,403 | 10,352 | 10,371 | 10,150 | 9,410 | 10,935 | 11,826 | 13,048 |
| 2012 | 13,219 | 11,463 | 12,569 | 11,483 | 11,795 | 11,836 | 11,501 | 11,867 | 11,240 | 12,002 | 11,725 | 11,728 |
| 2013 | 8,802 | 6,825 | 8,305 | 10,550 | 10,794 | 9,841 | 9,811 | 9,998 | 10,249 | 10,728 | 9,444 | 8,129 |
| 2014 | 8,397 | 8,611 | 8,338 | 7,416 | 10,527 | 10,411 | 10,316 | 9,610 | 9,899 | 10,343 | 8,768 | 8,356 |
| 2015 | 10,039 | 9,042 | 11,461 | 12,995 | 16,785 | 16,643 | 18,528 | 17,488 | 16,075 | 15,406 | 14,485 | 16,572 |
| 2016 | 16,549 | 16,594 | 19,669 | 20,564 | 21,325 | 18,555 | 20,550 | 21,347 | 19,762 | 20,401 | 19,834 | 16,491 |
| 2017 | 17,633 | 19,309 | 22,971 | 21,544 | 22,582 | 21,346 | 21,976 | 22,253 | 19,427 | 21,338 | 21,468 | 22,906 |
| 2018 | 24,238 | 23,601 | 27,322 | 26,118 | 27,558 | 26,690 | 26,429 | 28,386 | 25,636 | 26,315 | 26,463 | 24,297 |
| 2019 | 25,488 | 24,759 | 28,763 | 28,353 | 27,933 | 26,835 | 25,746 | 27,626 | 28,921 | 29,724 | 24,919 | 24,735 |
| 2020 | 27,599 | 26,100 | 28,515 | 26,702 | 26,574 | 26,453 | 28,868 | 31,137 | 30,660 | 27,593 | 26,162 | 30,814 |
| 2021 | 29,760 | 24,573 | 31,137 | 35,799 | 33,350 | 33,403 | 33,970 | 33,193 | 32,954 | 32,979 | 33,027 | 34,422 |
| 2022 | 31,487 | 28,126 | 35,669 | 35,355 | 34,634 | 36,594 | 38,353 | 38,370 | 33,277 | 32,593 | 34,407 | 29,906 |
| 2023 | 31,872 | 33,794 | 40,243 | 39,435 | 36,708 | 35,634 | 39,331 | 40,093 | 38,556 | 38,944 | 37,015 | 35,364 |
| 2024 | 30,117 | |||||||||||
| - = No Data Reported; -- = Not Applicable; NA = Not Available; W = Withheld to avoid disclosure of individual company data. |
| Release Date: 3/29/2024 |
| Next Release Date: 4/30/2024 |