|
Download Data (XLS File) |
|
||||||||
|
||||||||
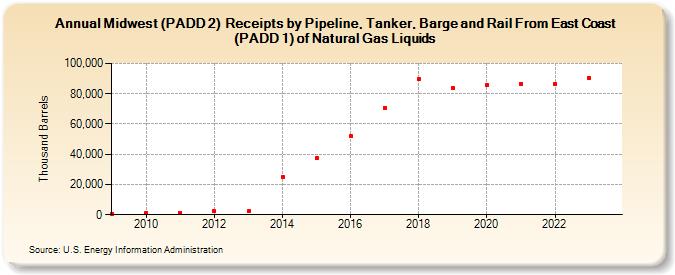
| Midwest (PADD 2) Receipts by Pipeline, Tanker, Barge and Rail From East Coast (PADD 1) of Natural Gas Liquids (Thousand Barrels) | ||||||||
| Decade | Year-0 | Year-1 | Year-2 | Year-3 | Year-4 | Year-5 | Year-6 | Year-7 | Year-8 | Year-9 |
|---|---|---|---|---|---|---|---|---|---|---|
| 2000's | 756 | |||||||||
| 2010's | 1,193 | 1,446 | 2,132 | 2,133 | 25,135 | 37,188 | 51,963 | 70,769 | 89,661 | 83,625 |
| 2020's | 85,726 | 86,714 | 86,517 | 90,260 |
| - = No Data Reported; -- = Not Applicable; NA = Not Available; W = Withheld to avoid disclosure of individual company data. |
| Release Date: 3/29/2024 |
| Next Release Date: 8/30/2024 |