|
Download Data (XLS File) |
|
||||||||
|
||||||||
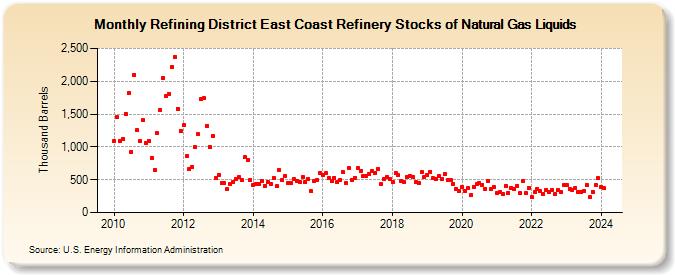
| Refining District East Coast Refinery Stocks of Natural Gas Liquids (Thousand Barrels) | ||||||||
| Year | Jan | Feb | Mar | Apr | May | Jun | Jul | Aug | Sep | Oct | Nov | Dec |
|---|---|---|---|---|---|---|---|---|---|---|---|---|
| 2010 | 1,091 | 1,449 | 1,090 | 1,126 | 1,507 | 1,820 | 927 | 2,099 | 1,252 | 1,085 | 1,408 | 1,058 |
| 2011 | 1,093 | 834 | 652 | 1,206 | 1,564 | 2,050 | 1,768 | 1,811 | 2,217 | 2,374 | 1,583 | 1,243 |
| 2012 | 1,327 | 856 | 664 | 690 | 996 | 1,189 | 1,722 | 1,743 | 1,325 | 999 | 1,170 | 528 |
| 2013 | 570 | 450 | 447 | 352 | 436 | 464 | 514 | 539 | 490 | 840 | 808 | 503 |
| 2014 | 422 | 438 | 429 | 482 | 410 | 463 | 429 | 533 | 400 | 648 | 501 | 553 |
| 2015 | 453 | 449 | 505 | 486 | 470 | 541 | 458 | 511 | 324 | 483 | 500 | 607 |
| 2016 | 577 | 600 | 523 | 482 | 533 | 458 | 498 | 613 | 447 | 683 | 500 | 531 |
| 2017 | 679 | 631 | 560 | 557 | 590 | 627 | 609 | 666 | 429 | 511 | 535 | 513 |
| 2018 | 461 | 608 | 566 | 475 | 472 | 548 | 561 | 546 | 463 | 447 | 611 | 542 |
| 2019 | 567 | 621 | 521 | 518 | 555 | 506 | 593 | 492 | 498 | 435 | 361 | 335 |
| 2020 | 393 | 335 | 377 | 265 | 393 | 430 | 450 | 424 | 366 | 476 | 362 | 387 |
| 2021 | 300 | 308 | 285 | 408 | 302 | 377 | 353 | 412 | 296 | 487 | 294 | 377 |
| 2022 | 239 | 308 | 357 | 324 | 290 | 349 | 309 | 346 | 280 | 341 | 315 | 423 |
| 2023 | 425 | 361 | 337 | 374 | 310 | 318 | 327 | 422 | 230 | 317 | 424 | 520 |
| 2024 | 390 | |||||||||||
| - = No Data Reported; -- = Not Applicable; NA = Not Available; W = Withheld to avoid disclosure of individual company data. |
| Release Date: 3/29/2024 |
| Next Release Date: 4/30/2024 |
Referring Pages: