|
Download Data (XLS File) |
|
||||||||
|
||||||||
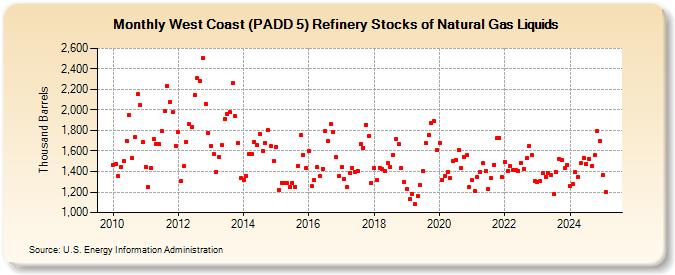
| West Coast (PADD 5) Refinery Stocks of Natural Gas Liquids (Thousand Barrels) | ||||||||
| Year | Jan | Feb | Mar | Apr | May | Jun | Jul | Aug | Sep | Oct | Nov | Dec |
|---|---|---|---|---|---|---|---|---|---|---|---|---|
| 2010 | 1,468 | 1,472 | 1,355 | 1,447 | 1,498 | 1,697 | 1,951 | 1,535 | 1,733 | 2,151 | 2,046 | 1,683 |
| 2011 | 1,440 | 1,251 | 1,436 | 1,715 | 1,666 | 1,666 | 1,794 | 1,990 | 2,238 | 2,080 | 1,976 | 1,649 |
| 2012 | 1,786 | 1,304 | 1,449 | 1,689 | 1,860 | 1,831 | 2,146 | 2,307 | 2,284 | 2,506 | 2,061 | 1,778 |
| 2013 | 1,645 | 1,571 | 1,399 | 1,543 | 1,658 | 1,912 | 1,958 | 1,977 | 2,262 | 1,937 | 1,680 | 1,333 |
| 2014 | 1,316 | 1,361 | 1,568 | 1,571 | 1,689 | 1,654 | 1,769 | 1,604 | 1,681 | 1,803 | 1,644 | 1,502 |
| 2015 | 1,642 | 1,221 | 1,291 | 1,290 | 1,288 | 1,249 | 1,292 | 1,252 | 1,456 | 1,754 | 1,565 | 1,435 |
| 2016 | 1,599 | 1,256 | 1,317 | 1,440 | 1,355 | 1,429 | 1,797 | 1,702 | 1,863 | 1,790 | 1,540 | 1,354 |
| 2017 | 1,445 | 1,329 | 1,253 | 1,382 | 1,437 | 1,398 | 1,406 | 1,668 | 1,634 | 1,858 | 1,747 | 1,285 |
| 2018 | 1,437 | 1,313 | 1,437 | 1,420 | 1,405 | 1,484 | 1,442 | 1,564 | 1,715 | 1,666 | 1,434 | 1,297 |
| 2019 | 1,226 | 1,130 | 1,183 | 1,079 | 1,161 | 1,268 | 1,403 | 1,675 | 1,756 | 1,872 | 1,889 | 1,611 |
| 2020 | 1,681 | 1,322 | 1,357 | 1,396 | 1,337 | 1,499 | 1,515 | 1,611 | 1,434 | 1,543 | 1,558 | 1,253 |
| 2021 | 1,314 | 1,214 | 1,348 | 1,397 | 1,480 | 1,408 | 1,231 | 1,334 | 1,466 | 1,723 | 1,727 | 1,346 |
| 2022 | 1,495 | 1,406 | 1,453 | 1,413 | 1,412 | 1,409 | 1,486 | 1,429 | 1,527 | 1,653 | 1,561 | 1,304 |
| 2023 | 1,306 | 1,304 | 1,384 | 1,351 | 1,385 | 1,368 | 1,180 | 1,395 | 1,524 | 1,510 | 1,430 | 1,468 |
| 2024 | 1,262 | |||||||||||
| - = No Data Reported; -- = Not Applicable; NA = Not Available; W = Withheld to avoid disclosure of individual company data. |
| Release Date: 3/29/2024 |
| Next Release Date: 4/30/2024 |