|
Download Data (XLS File) |
|
||||||||
|
||||||||
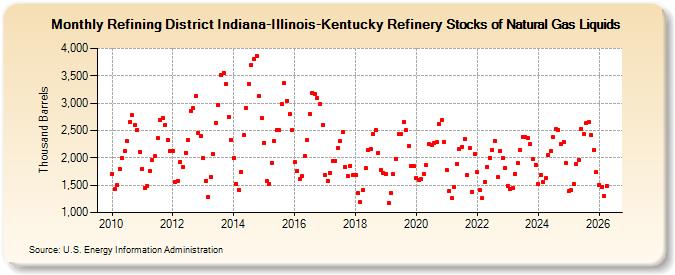
| Refining District Indiana-Illinois-Kentucky Refinery Stocks of Natural Gas Liquids (Thousand Barrels) | ||||||||
| Year | Jan | Feb | Mar | Apr | May | Jun | Jul | Aug | Sep | Oct | Nov | Dec |
|---|---|---|---|---|---|---|---|---|---|---|---|---|
| 2010 | 1,709 | 1,431 | 1,507 | 1,792 | 2,001 | 2,125 | 2,307 | 2,652 | 2,775 | 2,594 | 2,513 | 2,115 |
| 2011 | 1,805 | 1,453 | 1,486 | 1,760 | 1,962 | 2,031 | 2,358 | 2,687 | 2,729 | 2,591 | 2,334 | 2,134 |
| 2012 | 2,126 | 1,562 | 1,584 | 1,930 | 1,838 | 2,093 | 2,330 | 2,854 | 2,904 | 3,131 | 2,457 | 2,407 |
| 2013 | 1,990 | 1,584 | 1,292 | 1,644 | 2,066 | 2,641 | 2,966 | 3,505 | 3,555 | 3,350 | 2,752 | 2,334 |
| 2014 | 1,996 | 1,531 | 1,419 | 1,746 | 2,411 | 2,911 | 3,358 | 3,705 | 3,809 | 3,867 | 3,128 | 2,728 |
| 2015 | 2,272 | 1,578 | 1,529 | 1,914 | 2,305 | 2,517 | 2,503 | 2,982 | 3,365 | 3,042 | 2,796 | 2,507 |
| 2016 | 1,922 | 1,765 | 1,608 | 1,674 | 2,036 | 2,320 | 2,809 | 3,190 | 3,163 | 3,101 | 2,977 | 2,605 |
| 2017 | 1,679 | 1,584 | 1,730 | 1,948 | 1,951 | 2,186 | 2,309 | 2,480 | 1,837 | 1,661 | 1,858 | 1,690 |
| 2018 | 1,693 | 1,350 | 1,189 | 1,415 | 1,809 | 2,142 | 2,161 | 2,430 | 2,509 | 2,096 | 1,776 | 1,730 |
| 2019 | 1,709 | 1,182 | 1,352 | 1,700 | 1,980 | 2,434 | 2,439 | 2,664 | 2,500 | 2,220 | 1,844 | 1,850 |
| 2020 | 1,639 | 1,592 | 1,606 | 1,706 | 1,869 | 2,248 | 2,243 | 2,263 | 2,283 | 2,615 | 2,687 | 2,297 |
| 2021 | 1,776 | 1,401 | 1,263 | 1,468 | 1,891 | 2,156 | 2,207 | 2,343 | 1,680 | 2,172 | 1,383 | 2,078 |
| 2022 | 1,735 | 1,413 | 1,260 | 1,560 | 1,840 | 2,004 | 2,151 | 2,308 | 1,644 | 2,126 | 2,001 | 1,816 |
| 2023 | 1,492 | 1,438 | 1,452 | 1,701 | 1,904 | 2,139 | 2,377 | 2,384 | 2,370 | 2,252 | 1,972 | 1,872 |
| 2024 | 1,521 | |||||||||||
| - = No Data Reported; -- = Not Applicable; NA = Not Available; W = Withheld to avoid disclosure of individual company data. |
| Release Date: 3/29/2024 |
| Next Release Date: 4/30/2024 |