|
Download Data (XLS File) |
|
||||||||
|
||||||||
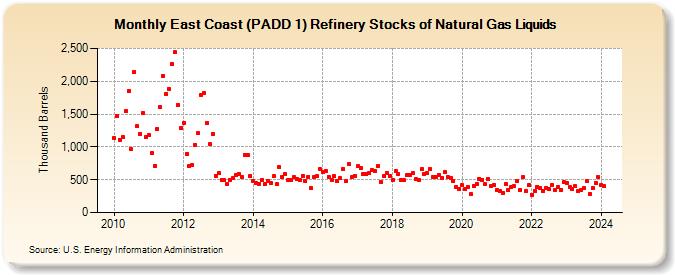
| East Coast (PADD 1) Refinery Stocks of Natural Gas Liquids (Thousand Barrels) | ||||||||
| Year | Jan | Feb | Mar | Apr | May | Jun | Jul | Aug | Sep | Oct | Nov | Dec |
|---|---|---|---|---|---|---|---|---|---|---|---|---|
| 2010 | 1,134 | 1,474 | 1,110 | 1,144 | 1,546 | 1,848 | 962 | 2,145 | 1,313 | 1,197 | 1,514 | 1,153 |
| 2011 | 1,174 | 906 | 711 | 1,273 | 1,602 | 2,085 | 1,810 | 1,885 | 2,261 | 2,445 | 1,640 | 1,284 |
| 2012 | 1,370 | 899 | 709 | 726 | 1,033 | 1,205 | 1,795 | 1,818 | 1,367 | 1,042 | 1,201 | 562 |
| 2013 | 603 | 503 | 495 | 434 | 501 | 526 | 579 | 591 | 548 | 884 | 878 | 553 |
| 2014 | 476 | 447 | 439 | 503 | 429 | 477 | 447 | 551 | 428 | 691 | 538 | 590 |
| 2015 | 493 | 495 | 534 | 515 | 493 | 558 | 476 | 545 | 370 | 536 | 554 | 659 |
| 2016 | 613 | 626 | 542 | 499 | 553 | 479 | 521 | 663 | 483 | 738 | 540 | 561 |
| 2017 | 704 | 673 | 593 | 581 | 607 | 645 | 626 | 709 | 467 | 557 | 599 | 551 |
| 2018 | 490 | 631 | 588 | 495 | 489 | 568 | 578 | 596 | 506 | 496 | 658 | 590 |
| 2019 | 596 | 661 | 544 | 537 | 569 | 532 | 616 | 540 | 530 | 482 | 390 | 355 |
| 2020 | 418 | 354 | 395 | 278 | 410 | 442 | 517 | 502 | 428 | 512 | 409 | 426 |
| 2021 | 342 | 335 | 303 | 433 | 338 | 396 | 397 | 482 | 350 | 534 | 335 | 417 |
| 2022 | 275 | 334 | 396 | 374 | 329 | 380 | 354 | 423 | 350 | 385 | 351 | 465 |
| 2023 | 456 | 387 | 358 | 398 | 324 | 338 | 367 | 482 | 289 | 367 | 454 | 544 |
| 2024 | 417 | 398 | 366 | 435 | ||||||||
| - = No Data Reported; -- = Not Applicable; NA = Not Available; W = Withheld to avoid disclosure of individual company data. |
| Release Date: 6/28/2024 |
| Next Release Date: 7/31/2024 |