|
Download Data (XLS File) |
|
||||||||
|
||||||||
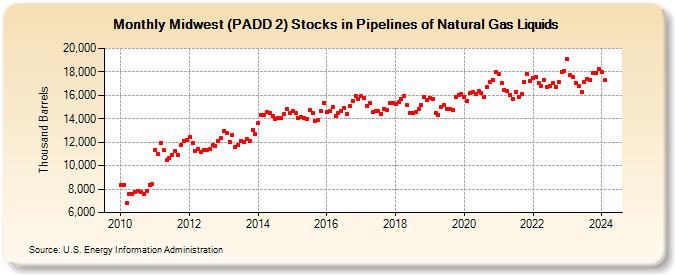
| Midwest (PADD 2) Stocks in Pipelines of Natural Gas Liquids (Thousand Barrels) | ||||||||
| Year | Jan | Feb | Mar | Apr | May | Jun | Jul | Aug | Sep | Oct | Nov | Dec |
|---|---|---|---|---|---|---|---|---|---|---|---|---|
| 2010 | 8,326 | 8,325 | 6,797 | 7,593 | 7,546 | 7,775 | 7,871 | 7,767 | 7,587 | 7,880 | 8,384 | 8,403 |
| 2011 | 11,359 | 10,994 | 11,958 | 11,326 | 10,444 | 10,668 | 10,897 | 11,287 | 10,926 | 11,769 | 12,093 | 12,186 |
| 2012 | 12,427 | 11,908 | 11,290 | 11,436 | 11,123 | 11,345 | 11,314 | 11,392 | 11,750 | 11,668 | 12,099 | 12,332 |
| 2013 | 12,972 | 12,755 | 12,005 | 12,576 | 11,557 | 11,746 | 12,124 | 12,022 | 12,293 | 12,126 | 13,065 | 12,694 |
| 2014 | 13,607 | 14,346 | 14,330 | 14,545 | 14,463 | 14,248 | 13,987 | 14,073 | 14,047 | 14,438 | 14,798 | 14,467 |
| 2015 | 14,644 | 14,486 | 14,106 | 14,160 | 14,076 | 13,973 | 14,737 | 14,450 | 13,804 | 13,888 | 14,623 | 15,374 |
| 2016 | 14,537 | 14,626 | 15,010 | 14,221 | 14,513 | 14,676 | 14,921 | 14,443 | 15,098 | 15,525 | 15,923 | 15,654 |
| 2017 | 15,915 | 15,802 | 15,091 | 15,314 | 14,541 | 14,698 | 14,624 | 14,444 | 14,820 | 14,708 | 15,305 | 15,346 |
| 2018 | 15,259 | 15,412 | 15,722 | 15,922 | 15,131 | 14,529 | 14,532 | 14,552 | 14,822 | 15,171 | 15,856 | 15,567 |
| 2019 | 15,811 | 15,708 | 14,499 | 14,340 | 14,980 | 15,142 | 14,865 | 14,826 | 14,722 | 15,867 | 16,003 | 16,089 |
| 2020 | 15,881 | 15,535 | 16,174 | 16,282 | 16,093 | 16,343 | 16,188 | 15,832 | 16,701 | 17,138 | 17,291 | 17,963 |
| 2021 | 17,813 | 17,014 | 16,481 | 16,332 | 16,061 | 15,685 | 16,263 | 15,876 | 16,134 | 17,150 | 17,781 | 17,201 |
| 2022 | 17,485 | 17,577 | 17,088 | 16,784 | 17,329 | 16,666 | 16,776 | 17,033 | 16,698 | 17,124 | 18,016 | 18,039 |
| 2023 | 19,065 | 17,730 | 17,530 | 17,030 | 16,783 | 16,275 | 17,109 | 17,422 | 17,305 | 17,917 | 17,887 | 18,237 |
| 2024 | 18,005 | |||||||||||
| - = No Data Reported; -- = Not Applicable; NA = Not Available; W = Withheld to avoid disclosure of individual company data. |
| Release Date: 3/29/2024 |
| Next Release Date: 4/30/2024 |