|
Download Data (XLS File) |
|
||||||||
|
||||||||
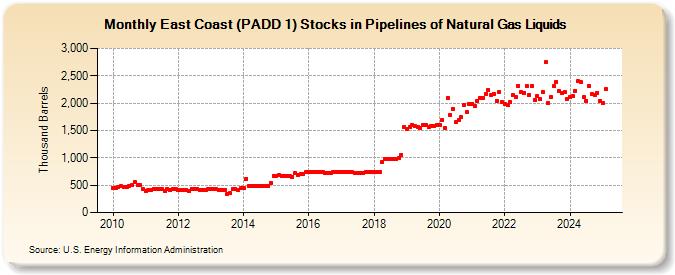
| East Coast (PADD 1) Stocks in Pipelines of Natural Gas Liquids (Thousand Barrels) | ||||||||
| Year | Jan | Feb | Mar | Apr | May | Jun | Jul | Aug | Sep | Oct | Nov | Dec |
|---|---|---|---|---|---|---|---|---|---|---|---|---|
| 2010 | 456 | 452 | 463 | 477 | 471 | 472 | 479 | 496 | 552 | 501 | 503 | 422 |
| 2011 | 396 | 413 | 411 | 436 | 431 | 429 | 431 | 403 | 428 | 407 | 422 | 435 |
| 2012 | 412 | 412 | 410 | 410 | 387 | 431 | 430 | 428 | 415 | 418 | 420 | 423 |
| 2013 | 423 | 424 | 424 | 421 | 418 | 414 | 341 | 350 | 429 | 433 | 420 | 440 |
| 2014 | 443 | 621 | 490 | 491 | 487 | 485 | 482 | 482 | 486 | 485 | 547 | 673 |
| 2015 | 677 | 679 | 674 | 676 | 669 | 664 | 657 | 718 | 695 | 696 | 702 | 736 |
| 2016 | 741 | 745 | 741 | 738 | 736 | 734 | 725 | 726 | 730 | 735 | 737 | 742 |
| 2017 | 744 | 741 | 746 | 738 | 733 | 727 | 725 | 727 | 715 | 750 | 737 | 737 |
| 2018 | 736 | 738 | 738 | 921 | 975 | 978 | 976 | 975 | 978 | 990 | 1,056 | 1,559 |
| 2019 | 1,530 | 1,565 | 1,605 | 1,581 | 1,570 | 1,553 | 1,592 | 1,605 | 1,566 | 1,589 | 1,579 | 1,599 |
| 2020 | 1,599 | 1,698 | 1,549 | 2,100 | 1,790 | 1,899 | 1,654 | 1,683 | 1,738 | 1,963 | 1,838 | 1,979 |
| 2021 | 1,992 | 1,947 | 2,046 | 2,091 | 2,102 | 2,170 | 2,243 | 2,149 | 2,170 | 2,047 | 2,208 | 2,017 |
| 2022 | 1,980 | 1,963 | 2,012 | 2,142 | 2,120 | 2,321 | 2,197 | 2,192 | 2,314 | 2,148 | 2,312 | 2,060 |
| 2023 | 2,124 | 2,071 | 2,289 | 2,745 | 2,002 | 2,112 | 2,310 | 2,384 | 2,228 | 2,182 | 2,205 | 2,082 |
| 2024 | 2,117 | |||||||||||
| - = No Data Reported; -- = Not Applicable; NA = Not Available; W = Withheld to avoid disclosure of individual company data. |
| Release Date: 3/29/2024 |
| Next Release Date: 4/30/2024 |