|
Download Data (XLS File) |
|
||||||||
|
||||||||
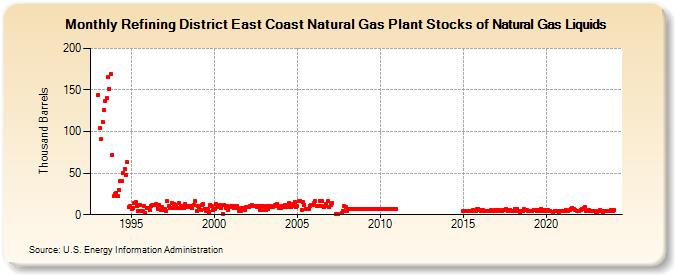
| Refining District East Coast Natural Gas Plant Stocks of Natural Gas Liquids (Thousand Barrels) | ||||||||
| Year | Jan | Feb | Mar | Apr | May | Jun | Jul | Aug | Sep | Oct | Nov | Dec |
|---|---|---|---|---|---|---|---|---|---|---|---|---|
| 1993 | 144 | 104 | 91 | 112 | 126 | 137 | 140 | 166 | 151 | 169 | 72 | 22 |
| 1994 | 25 | 26 | 22 | 30 | 41 | 40 | 50 | 55 | 48 | 63 | 9 | 10 |
| 1995 | 7 | 8 | 14 | 15 | 11 | 5 | 12 | 5 | 5 | 11 | 2 | 8 |
| 1996 | 8 | 6 | 11 | 12 | 12 | 12 | 13 | 7 | 12 | 6 | 9 | 6 |
| 1997 | 7 | 5 | 16 | 11 | 8 | 14 | 8 | 13 | 12 | 8 | 14 | 8 |
| 1998 | 11 | 9 | 8 | 13 | 11 | 9 | 10 | 11 | 8 | 12 | 16 | 5 |
| 1999 | 11 | 9 | 6 | 12 | 13 | 7 | 4 | 7 | 3 | 12 | 10 | 6 |
| 2000 | 7 | 13 | 9 | 10 | 12 | 8 | 1 | 12 | 8 | 10 | 6 | 9 |
| 2001 | 10 | 11 | 8 | 11 | 11 | 8 | 5 | 5 | 8 | 8 | 6 | 9 |
| 2002 | 9 | 9 | 11 | 12 | 11 | 10 | 11 | 9 | 11 | 6 | 11 | 11 |
| 2003 | 6 | 6 | 10 | 7 | 11 | 9 | 9 | 10 | 12 | 13 | 10 | 8 |
| 2004 | 8 | 10 | 9 | 12 | 9 | 9 | 14 | 9 | 11 | 13 | 15 | 9 |
| 2005 | 10 | 16 | 17 | 6 | 15 | 12 | 7 | 7 | 7 | 11 | 12 | 12 |
| 2006 | 14 | 16 | 11 | 11 | 17 | 11 | 16 | 9 | 11 | 13 | 16 | 9 |
| 2007 | 12 | 14 | 1 | 1 | 2 | 5 | 10 | 9 | ||||
| 2008 | 4 | 7 | 7 | 7 | 7 | 7 | 7 | 7 | 7 | 7 | 7 | 7 |
| 2009 | 7 | 7 | 7 | 7 | 7 | 7 | 7 | 7 | 7 | 7 | 7 | 7 |
| 2010 | 7 | 7 | 7 | 7 | 7 | 7 | 7 | 7 | 7 | 7 | 7 | 7 |
| 2015 | 5 | 5 | 5 | 4 | 5 | 5 | 4 | 6 | 4 | 4 | 7 | 7 |
| 2016 | 6 | 5 | 6 | 4 | 4 | 5 | 5 | 5 | 6 | 5 | 5 | 6 |
| 2017 | 5 | 6 | 6 | 5 | 4 | 6 | 6 | 7 | 5 | 6 | 6 | 5 |
| 2018 | 5 | 7 | 5 | 7 | 5 | 3 | 5 | 5 | 7 | 6 | 6 | 5 |
| 2019 | 5 | 5 | 5 | 6 | 6 | 5 | 6 | 4 | 7 | 4 | 6 | 5 |
| 2020 | 6 | 6 | 5 | 5 | 3 | 5 | 4 | 5 | 3 | 5 | 5 | |
| 2021 | 5 | 4 | 6 | 5 | 5 | 6 | 7 | 8 | 7 | 6 | 4 | 4 |
| 2022 | 4 | 6 | 7 | 8 | 9 | 5 | 5 | 6 | 5 | 4 | 5 | 4 |
| 2023 | 3 | 3 | 4 | 6 | 5 | 3 | 5 | 5 | 4 | 4 | 4 | 6 |
| 2024 | 5 | 6 | ||||||||||
| - = No Data Reported; -- = Not Applicable; NA = Not Available; W = Withheld to avoid disclosure of individual company data. |
| Release Date: 4/30/2024 |
| Next Release Date: 5/31/2024 |