|
Download Data (XLS File) |
|
||||||||
|
||||||||
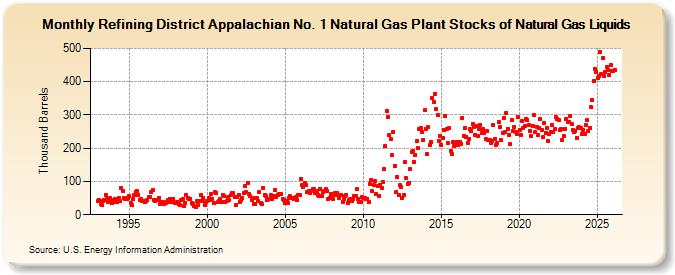
| Refining District Appalachian No. 1 Natural Gas Plant Stocks of Natural Gas Liquids (Thousand Barrels) | ||||||||
| Year | Jan | Feb | Mar | Apr | May | Jun | Jul | Aug | Sep | Oct | Nov | Dec |
|---|---|---|---|---|---|---|---|---|---|---|---|---|
| 1993 | 42 | 43 | 32 | 29 | 42 | 45 | 60 | 47 | 39 | 50 | 45 | 36 |
| 1994 | 39 | 47 | 39 | 37 | 50 | 40 | 80 | 72 | 51 | 48 | 48 | 51 |
| 1995 | 57 | 35 | 29 | 48 | 58 | 69 | 71 | 59 | 43 | 47 | 42 | 42 |
| 1996 | 37 | 42 | 44 | 52 | 52 | 69 | 75 | 43 | 40 | 43 | 44 | 51 |
| 1997 | 31 | 39 | 37 | 31 | 34 | 39 | 45 | 48 | 39 | 38 | 47 | 35 |
| 1998 | 36 | 39 | 32 | 30 | 44 | 46 | 25 | 35 | 59 | 51 | 47 | 48 |
| 1999 | 34 | 32 | 26 | 23 | 40 | 29 | 40 | 59 | 41 | 51 | 30 | 37 |
| 2000 | 40 | 49 | 45 | 63 | 47 | 35 | 67 | 65 | 37 | 42 | 46 | 37 |
| 2001 | 58 | 55 | 39 | 40 | 52 | 44 | 58 | 65 | 65 | 52 | 30 | 52 |
| 2002 | 58 | 39 | 43 | 51 | 64 | 87 | 67 | 94 | 63 | 57 | 45 | 50 |
| 2003 | 33 | 31 | 51 | 41 | 67 | 36 | 31 | 81 | 60 | 56 | 44 | 47 |
| 2004 | 47 | 58 | 47 | 57 | 73 | 52 | 59 | 63 | 63 | 62 | 46 | 43 |
| 2005 | 36 | 41 | 34 | 51 | 55 | 51 | 49 | 46 | 52 | 45 | 59 | 60 |
| 2006 | 107 | 88 | 82 | 94 | 90 | 68 | 70 | 65 | 71 | 78 | 78 | 65 |
| 2007 | 71 | 60 | 56 | 78 | 56 | 67 | 72 | 76 | 72 | 48 | 51 | 63 |
| 2008 | 52 | 47 | 64 | 58 | 66 | 50 | 60 | 58 | 38 | 47 | 55 | 60 |
| 2009 | 34 | 45 | 46 | 42 | 47 | 55 | 56 | 76 | 47 | 39 | 39 | 53 |
| 2010 | 50 | 50 | 48 | 48 | 37 | 92 | 104 | 70 | 88 | 100 | 61 | 86 |
| 2011 | 57 | 89 | 79 | 97 | 138 | 206 | 312 | 295 | 239 | 227 | 180 | 250 |
| 2012 | 147 | 67 | 112 | 59 | 88 | 84 | 51 | 60 | 159 | 109 | 93 | 96 |
| 2013 | 136 | 190 | 192 | 159 | 179 | 221 | 200 | 259 | 260 | 249 | 226 | 314 |
| 2014 | 259 | 184 | 263 | 209 | 219 | 350 | 339 | 363 | 318 | 300 | 223 | 237 |
| 2015 | 211 | 230 | 256 | 296 | 258 | 217 | 260 | 192 | 182 | 218 | 208 | 211 |
| 2016 | 218 | 209 | 219 | 214 | 292 | 238 | 260 | 235 | 215 | 227 | 257 | 252 |
| 2017 | 273 | 264 | 241 | 266 | 238 | 259 | 269 | 245 | 257 | 245 | 228 | 252 |
| 2018 | 224 | 224 | 217 | 223 | 269 | 229 | 210 | 216 | 278 | 265 | 225 | 247 |
| 2019 | 291 | 250 | 307 | 259 | 241 | 212 | 286 | 252 | 265 | 249 | 243 | 293 |
| 2020 | 255 | 240 | 281 | 261 | 268 | 289 | 284 | 270 | 251 | 237 | 267 | 299 |
| 2021 | 250 | 263 | 240 | 262 | 287 | 256 | 233 | 276 | 246 | 261 | 221 | 244 |
| 2022 | 248 | 270 | 249 | 259 | 293 | 288 | 285 | 254 | 257 | 226 | 238 | 258 |
| 2023 | 289 | 280 | 279 | 297 | 273 | 256 | 248 | 253 | 233 | 263 | 265 | 262 |
| 2024 | 244 | |||||||||||
| - = No Data Reported; -- = Not Applicable; NA = Not Available; W = Withheld to avoid disclosure of individual company data. |
| Release Date: 3/29/2024 |
| Next Release Date: 4/30/2024 |