|
Download Data (XLS File) |
|
||||||||
|
||||||||
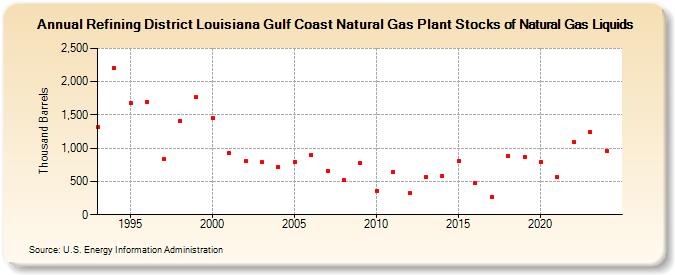
| Refining District Louisiana Gulf Coast Natural Gas Plant Stocks of Natural Gas Liquids (Thousand Barrels) | ||||||||
| Decade | Year-0 | Year-1 | Year-2 | Year-3 | Year-4 | Year-5 | Year-6 | Year-7 | Year-8 | Year-9 |
|---|---|---|---|---|---|---|---|---|---|---|
| 1990's | 1,313 | 2,202 | 1,678 | 1,701 | 835 | 1,411 | 1,769 | |||
| 2000's | 1,448 | 921 | 808 | 788 | 717 | 794 | 905 | 664 | 516 | 774 |
| 2010's | 363 | 640 | 327 | 564 | 583 | 806 | 480 | 262 | 883 | 865 |
| 2020's | 797 | 563 | 1,093 | 1,241 |
| - = No Data Reported; -- = Not Applicable; NA = Not Available; W = Withheld to avoid disclosure of individual company data. |
| Release Date: 4/30/2024 |
| Next Release Date: 8/30/2024 |