|
Download Data (XLS File) |
|
||||||||
|
||||||||
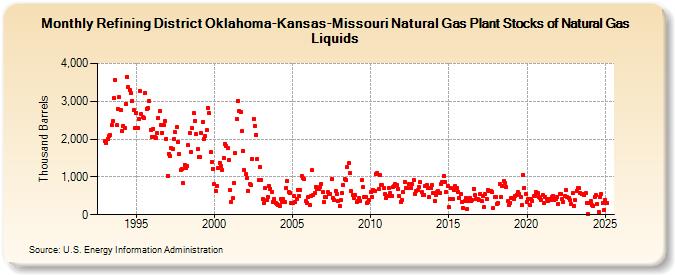
| Refining District Oklahoma-Kansas-Missouri Natural Gas Plant Stocks of Natural Gas Liquids (Thousand Barrels) | ||||||||
| Year | Jan | Feb | Mar | Apr | May | Jun | Jul | Aug | Sep | Oct | Nov | Dec |
|---|---|---|---|---|---|---|---|---|---|---|---|---|
| 1993 | 1,951 | 1,904 | 2,012 | 2,070 | 2,116 | 2,364 | 2,470 | 3,077 | 3,568 | 2,366 | 2,793 | 3,105 |
| 1994 | 2,764 | 2,218 | 2,350 | 2,300 | 2,941 | 3,654 | 3,371 | 3,294 | 3,208 | 3,014 | 2,760 | 2,287 |
| 1995 | 2,701 | 2,305 | 2,525 | 3,264 | 2,652 | 2,572 | 2,552 | 3,213 | 2,802 | 2,821 | 3,006 | 2,252 |
| 1996 | 2,060 | 2,279 | 2,058 | 2,033 | 2,170 | 2,561 | 2,733 | 2,373 | 2,169 | 2,366 | 2,482 | 2,015 |
| 1997 | 1,034 | 1,616 | 1,551 | 1,763 | 1,730 | 2,005 | 2,181 | 2,315 | 1,927 | 1,607 | 1,174 | 1,217 |
| 1998 | 827 | 1,322 | 1,241 | 1,279 | 1,831 | 2,166 | 1,666 | 2,286 | 2,678 | 2,487 | 2,124 | 1,727 |
| 1999 | 1,520 | 1,539 | 2,152 | 2,448 | 2,000 | 2,089 | 2,235 | 2,824 | 2,681 | 1,652 | 1,404 | 1,211 |
| 2000 | 803 | 633 | 767 | 1,242 | 1,375 | 1,280 | 1,186 | 1,497 | 1,877 | 1,817 | 1,768 | 1,450 |
| 2001 | 666 | 348 | 432 | 847 | 1,629 | 2,544 | 3,016 | 2,739 | 2,713 | 2,208 | 1,686 | 1,175 |
| 2002 | 1,070 | 972 | 625 | 800 | 781 | 1,486 | 2,540 | 2,358 | 2,121 | 1,474 | 916 | 1,266 |
| 2003 | 919 | 411 | 311 | 709 | 381 | 472 | 758 | 693 | 589 | 339 | 420 | 317 |
| 2004 | 286 | 254 | 234 | 406 | 342 | 415 | 332 | 708 | 881 | 608 | 573 | 314 |
| 2005 | 310 | 491 | 346 | 425 | 661 | 496 | 660 | 1,025 | 964 | 933 | 356 | 304 |
| 2006 | 460 | 264 | 508 | 1,172 | 517 | 577 | 722 | 692 | 681 | 731 | 822 | 590 |
| 2007 | 326 | 475 | 462 | 588 | 556 | 550 | 944 | 452 | 398 | 629 | 543 | 367 |
| 2008 | 241 | 383 | 569 | 783 | 944 | 908 | 1,251 | 1,359 | 1,102 | 623 | 522 | 450 |
| 2009 | 513 | 330 | 374 | 446 | 357 | 906 | 728 | 479 | 479 | 323 | 345 | 380 |
| 2010 | 598 | 465 | 662 | 634 | 1,073 | 1,107 | 676 | 1,052 | 775 | 777 | 696 | 538 |
| 2011 | 441 | 487 | 713 | 571 | 485 | 721 | 755 | 805 | 785 | 679 | 490 | 349 |
| 2012 | 382 | 593 | 868 | 703 | 715 | 803 | 801 | 712 | 805 | 922 | 556 | 639 |
| 2013 | 642 | 731 | 858 | 592 | 527 | 524 | 761 | 791 | 717 | 462 | 697 | 773 |
| 2014 | 581 | 369 | 524 | 604 | 615 | 581 | 808 | 872 | 1,028 | 876 | 613 | 770 |
| 2015 | 194 | 403 | 696 | 409 | 656 | 753 | 706 | 610 | 442 | 554 | 348 | 190 |
| 2016 | 352 | 452 | 150 | 373 | 437 | 366 | 383 | 688 | 522 | 405 | 418 | 397 |
| 2017 | 559 | 373 | 483 | 195 | 553 | 426 | 664 | 627 | 625 | 601 | 181 | 460 |
| 2018 | 466 | 285 | 313 | 821 | 471 | 766 | 884 | 845 | 727 | 356 | 245 | 310 |
| 2019 | 432 | 447 | 419 | 505 | 524 | 589 | 551 | 474 | 244 | 1,053 | 713 | 541 |
| 2020 | 337 | 416 | 244 | 416 | 372 | 482 | 500 | 589 | 571 | 461 | 439 | 397 |
| 2021 | 518 | 305 | 466 | 419 | 355 | 416 | 399 | 465 | 504 | 377 | 406 | 462 |
| 2022 | 293 | 544 | 551 | 412 | 348 | 494 | 652 | 462 | 445 | 380 | 278 | 567 |
| 2023 | 241 | 376 | 630 | 711 | 699 | 580 | 537 | 557 | 510 | 567 | 311 | 8 |
| 2024 | 306 | |||||||||||
| - = No Data Reported; -- = Not Applicable; NA = Not Available; W = Withheld to avoid disclosure of individual company data. |
| Release Date: 3/29/2024 |
| Next Release Date: 4/30/2024 |