|
Download Data (XLS File) |
|
||||||||
|
||||||||
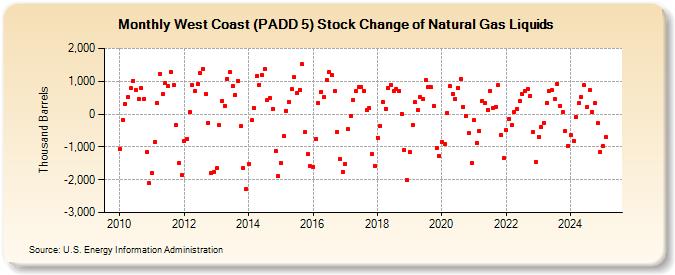
| West Coast (PADD 5) Stock Change of Natural Gas Liquids (Thousand Barrels) | ||||||||
| Year | Jan | Feb | Mar | Apr | May | Jun | Jul | Aug | Sep | Oct | Nov | Dec |
|---|---|---|---|---|---|---|---|---|---|---|---|---|
| 2010 | -1,070 | -171 | 312 | 514 | 782 | 1,020 | 722 | 452 | 795 | 467 | -1,149 | -2,108 |
| 2011 | -1,790 | -858 | 331 | 1,230 | 598 | 946 | 851 | 1,285 | 879 | -338 | -1,483 | -1,850 |
| 2012 | -814 | -754 | 58 | 886 | 705 | 911 | 1,237 | 1,377 | 620 | -262 | -1,804 | -1,768 |
| 2013 | -1,651 | -347 | 391 | 258 | 1,079 | 1,278 | 851 | 590 | 1,019 | -366 | -1,630 | -2,289 |
| 2014 | -1,522 | -191 | 191 | 1,151 | 900 | 1,196 | 1,358 | 418 | 485 | 154 | -1,122 | -1,891 |
| 2015 | -1,497 | -676 | 105 | 381 | 749 | 1,114 | 629 | 743 | 1,515 | -556 | -1,230 | -1,594 |
| 2016 | -1,603 | -752 | 334 | 679 | 505 | 1,039 | 1,266 | 1,189 | 692 | -541 | -1,371 | -1,751 |
| 2017 | -1,528 | -465 | -71 | 425 | 699 | 820 | 824 | 710 | 110 | 185 | -1,216 | -1,580 |
| 2018 | -714 | -367 | 361 | 162 | 794 | 894 | 709 | 766 | 703 | 4 | -1,090 | -2,021 |
| 2019 | -1,158 | -330 | 354 | 116 | 520 | 448 | 1,037 | 820 | 811 | 259 | -1,020 | -1,264 |
| 2020 | -851 | -923 | 37 | 842 | 621 | 462 | 802 | 1,070 | 213 | -44 | -589 | -1,494 |
| 2021 | -179 | -878 | -521 | 391 | 335 | 132 | 713 | 197 | 228 | 874 | -623 | -1,350 |
| 2022 | -497 | -139 | -345 | 75 | 166 | 401 | 605 | 697 | 756 | 560 | -554 | -1,452 |
| 2023 | -706 | -399 | -271 | 344 | 707 | 721 | 473 | 917 | 426 | -98 | -512 | -960 |
| 2024 | -646 | |||||||||||
| - = No Data Reported; -- = Not Applicable; NA = Not Available; W = Withheld to avoid disclosure of individual company data. |
| Release Date: 3/29/2024 |
| Next Release Date: 4/30/2024 |