|
Download Data (XLS File) |
|
||||||||
|
||||||||
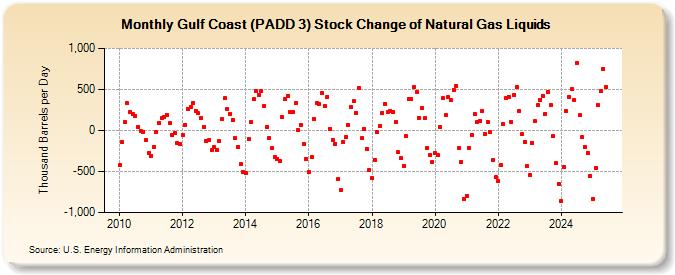
| Gulf Coast (PADD 3) Stock Change of Natural Gas Liquids (Thousand Barrels per Day) | ||||||||
| Year | Jan | Feb | Mar | Apr | May | Jun | Jul | Aug | Sep | Oct | Nov | Dec |
|---|---|---|---|---|---|---|---|---|---|---|---|---|
| 2010 | -426 | -143 | 98 | 331 | 225 | 197 | 175 | 44 | -5 | -14 | -114 | -274 |
| 2011 | -305 | -197 | -24 | 95 | 153 | 161 | 193 | 89 | -54 | -33 | -156 | -164 |
| 2012 | -55 | 68 | 256 | 286 | 338 | 243 | 209 | 154 | 47 | -134 | -118 | -235 |
| 2013 | -204 | -238 | -134 | 139 | 392 | 263 | 206 | 129 | -95 | -198 | -412 | -506 |
| 2014 | -524 | -99 | 100 | 383 | 480 | 438 | 481 | 303 | 44 | -93 | -219 | -325 |
| 2015 | -346 | -371 | 162 | 383 | 424 | 223 | 224 | 330 | 3 | 67 | -162 | -346 |
| 2016 | -505 | -324 | 142 | 332 | 328 | 458 | 298 | 413 | 21 | -115 | -160 | -593 |
| 2017 | -731 | -138 | -81 | 72 | 289 | 354 | 217 | 520 | -96 | 24 | -224 | -476 |
| 2018 | -581 | -356 | -21 | 52 | 218 | 327 | 223 | 239 | 223 | 106 | -268 | -340 |
| 2019 | -430 | -69 | 382 | 384 | 526 | 471 | 154 | 275 | 146 | -214 | -294 | -378 |
| 2020 | -279 | -304 | 40 | 390 | 190 | 402 | 370 | 499 | 547 | -219 | -381 | -833 |
| 2021 | -793 | -208 | -53 | 198 | 102 | 117 | 238 | -44 | 106 | -22 | -360 | -570 |
| 2022 | -619 | -426 | 73 | 396 | 413 | 106 | 437 | 524 | 235 | -46 | -135 | -435 |
| 2023 | -540 | -146 | 111 | 304 | 374 | 425 | 203 | 467 | 377 | -135 | -397 | -649 |
| 2024 | -861 | |||||||||||
| - = No Data Reported; -- = Not Applicable; NA = Not Available; W = Withheld to avoid disclosure of individual company data. |
| Release Date: 3/29/2024 |
| Next Release Date: 4/30/2024 |