|
Download Data (XLS File) |
|
||||||||
|
||||||||
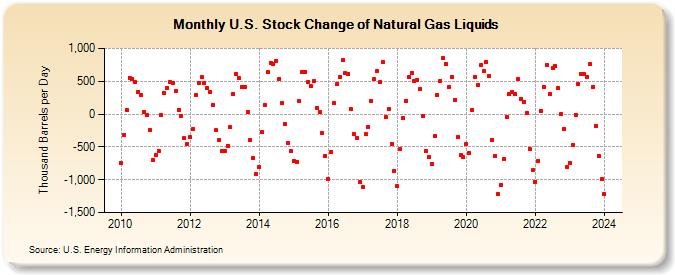
| U.S. Stock Change of Natural Gas Liquids (Thousand Barrels per Day) | ||||||||
| Year | Jan | Feb | Mar | Apr | May | Jun | Jul | Aug | Sep | Oct | Nov | Dec |
|---|---|---|---|---|---|---|---|---|---|---|---|---|
| 2010 | -746 | -315 | 68 | 556 | 536 | 487 | 334 | 284 | 32 | -21 | -237 | -697 |
| 2011 | -621 | -559 | -17 | 327 | 404 | 489 | 474 | 354 | 63 | -29 | -370 | -454 |
| 2012 | -346 | -224 | 284 | 479 | 560 | 467 | 396 | 339 | 139 | -248 | -398 | -569 |
| 2013 | -569 | -481 | -201 | 313 | 610 | 549 | 411 | 413 | 32 | -392 | -676 | -911 |
| 2014 | -806 | -280 | 141 | 633 | 784 | 762 | 810 | 534 | 172 | -156 | -446 | -569 |
| 2015 | -717 | -730 | 194 | 643 | 645 | 489 | 426 | 500 | 97 | 30 | -293 | -634 |
| 2016 | -989 | -576 | 164 | 463 | 570 | 818 | 620 | 615 | 73 | -305 | -363 | -1,035 |
| 2017 | -1,104 | -303 | -194 | 202 | 530 | 650 | 486 | 789 | -51 | 76 | -451 | -863 |
| 2018 | -1,100 | -534 | -67 | 206 | 562 | 630 | 506 | 523 | 389 | -37 | -562 | -653 |
| 2019 | -753 | -339 | 291 | 510 | 855 | 763 | 412 | 565 | 220 | -352 | -622 | -655 |
| 2020 | -455 | -593 | 63 | 563 | 449 | 744 | 652 | 796 | 578 | -393 | -636 | -1,212 |
| 2021 | -1,081 | -681 | -43 | 300 | 335 | 298 | 528 | 231 | 189 | 22 | -525 | -856 |
| 2022 | -1,031 | -712 | 43 | 409 | 746 | 304 | 696 | 725 | 400 | -4 | -223 | -802 |
| 2023 | -749 | -468 | -12 | 458 | 614 | 608 | 568 | 762 | 417 | -180 | -632 | -993 |
| 2024 | -1,219 | -762 | 184 | 643 | ||||||||
| - = No Data Reported; -- = Not Applicable; NA = Not Available; W = Withheld to avoid disclosure of individual company data. |
| Release Date: 6/28/2024 |
| Next Release Date: 7/31/2024 |
Referring Pages: