|
Download Data (XLS File) |
|
||||||||
|
||||||||
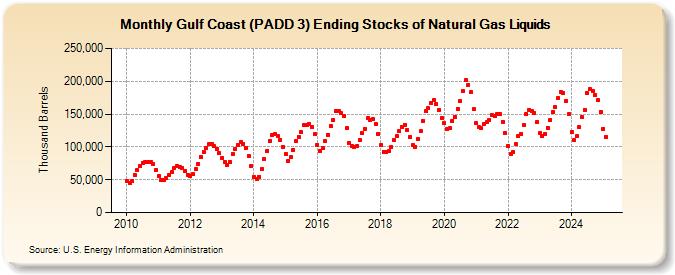
| Gulf Coast (PADD 3) Ending Stocks of Natural Gas Liquids (Thousand Barrels) | ||||||||
| Year | Jan | Feb | Mar | Apr | May | Jun | Jul | Aug | Sep | Oct | Nov | Dec |
|---|---|---|---|---|---|---|---|---|---|---|---|---|
| 2010 | 48,679 | 44,667 | 47,696 | 57,631 | 64,615 | 70,522 | 75,960 | 77,321 | 77,160 | 76,727 | 73,320 | 64,824 |
| 2011 | 55,380 | 49,865 | 49,113 | 51,968 | 56,707 | 61,532 | 67,511 | 70,259 | 68,625 | 67,614 | 62,920 | 57,849 |
| 2012 | 56,158 | 58,128 | 66,067 | 74,649 | 85,116 | 92,402 | 98,892 | 103,672 | 105,095 | 100,946 | 97,411 | 90,121 |
| 2013 | 83,785 | 77,120 | 72,981 | 77,152 | 89,296 | 97,196 | 103,579 | 107,577 | 104,714 | 98,591 | 86,218 | 70,521 |
| 2014 | 54,286 | 51,521 | 54,621 | 66,117 | 80,988 | 94,135 | 109,032 | 118,410 | 119,739 | 116,853 | 110,297 | 100,231 |
| 2015 | 89,507 | 79,122 | 84,139 | 95,632 | 108,781 | 115,471 | 122,402 | 132,642 | 132,730 | 134,814 | 129,941 | 119,200 |
| 2016 | 103,543 | 94,150 | 98,543 | 108,517 | 118,691 | 132,442 | 141,668 | 154,461 | 155,093 | 151,514 | 146,718 | 128,345 |
| 2017 | 105,691 | 101,841 | 99,341 | 101,499 | 110,469 | 121,097 | 127,837 | 143,942 | 141,064 | 141,804 | 135,086 | 120,340 |
| 2018 | 102,326 | 92,364 | 91,710 | 93,275 | 100,038 | 109,840 | 116,738 | 124,142 | 130,817 | 134,094 | 126,069 | 115,514 |
| 2019 | 102,181 | 100,258 | 112,087 | 123,599 | 139,896 | 154,033 | 158,802 | 167,323 | 171,688 | 165,067 | 156,247 | 144,536 |
| 2020 | 135,872 | 127,061 | 128,289 | 139,993 | 145,874 | 157,921 | 169,402 | 184,878 | 201,293 | 194,498 | 183,055 | 157,243 |
| 2021 | 135,722 | 129,894 | 128,236 | 134,171 | 137,348 | 140,846 | 148,220 | 146,870 | 150,046 | 149,372 | 138,578 | 120,913 |
| 2022 | 101,735 | 89,798 | 92,075 | 103,954 | 116,753 | 119,928 | 133,462 | 149,706 | 156,754 | 155,321 | 151,268 | 137,791 |
| 2023 | 121,083 | 116,987 | 120,436 | 129,556 | 141,146 | 153,886 | 160,168 | 174,645 | 185,953 | 181,756 | 169,841 | 149,717 |
| 2024 | 123,028 | |||||||||||
| - = No Data Reported; -- = Not Applicable; NA = Not Available; W = Withheld to avoid disclosure of individual company data. |
| Release Date: 3/29/2024 |
| Next Release Date: 4/30/2024 |