|
Download Data (XLS File) |
|
||||||||
|
||||||||
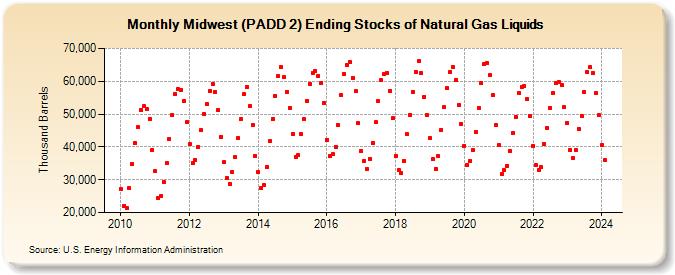
| Midwest (PADD 2) Ending Stocks of Natural Gas Liquids (Thousand Barrels) | ||||||||
| Year | Jan | Feb | Mar | Apr | May | Jun | Jul | Aug | Sep | Oct | Nov | Dec |
|---|---|---|---|---|---|---|---|---|---|---|---|---|
| 2010 | 27,159 | 21,988 | 21,445 | 27,401 | 34,788 | 41,170 | 45,923 | 51,162 | 52,336 | 51,511 | 48,612 | 39,060 |
| 2011 | 32,552 | 24,382 | 24,933 | 29,322 | 35,008 | 42,404 | 49,643 | 56,092 | 57,491 | 57,430 | 54,061 | 47,444 |
| 2012 | 40,869 | 35,166 | 36,094 | 40,051 | 45,048 | 50,030 | 53,011 | 57,068 | 59,187 | 56,674 | 51,217 | 43,094 |
| 2013 | 35,397 | 30,562 | 28,698 | 32,325 | 36,790 | 42,754 | 48,411 | 55,966 | 58,380 | 52,409 | 46,693 | 37,279 |
| 2014 | 32,344 | 27,357 | 28,331 | 33,939 | 41,690 | 48,449 | 55,585 | 61,444 | 64,263 | 61,193 | 56,774 | 51,900 |
| 2015 | 44,000 | 37,013 | 37,469 | 43,796 | 48,350 | 54,101 | 59,201 | 62,581 | 63,056 | 61,677 | 59,564 | 53,381 |
| 2016 | 42,231 | 37,221 | 37,703 | 39,950 | 46,605 | 55,707 | 62,315 | 65,004 | 65,776 | 61,125 | 56,887 | 47,247 |
| 2017 | 38,745 | 35,785 | 33,400 | 36,440 | 41,141 | 47,503 | 53,872 | 60,238 | 62,073 | 62,522 | 57,133 | 48,722 |
| 2018 | 37,282 | 32,850 | 32,001 | 35,813 | 43,889 | 49,767 | 56,799 | 62,874 | 66,036 | 62,377 | 55,316 | 49,674 |
| 2019 | 42,645 | 36,243 | 33,354 | 37,131 | 45,218 | 52,004 | 57,819 | 62,748 | 64,333 | 60,396 | 52,735 | 46,995 |
| 2020 | 40,423 | 34,624 | 35,692 | 39,033 | 44,585 | 51,795 | 59,490 | 65,254 | 65,548 | 61,822 | 55,722 | 46,683 |
| 2021 | 40,463 | 31,860 | 32,912 | 34,179 | 38,729 | 44,113 | 49,184 | 56,347 | 58,274 | 58,569 | 54,633 | 49,351 |
| 2022 | 40,282 | 34,485 | 32,878 | 33,778 | 41,029 | 45,892 | 51,852 | 56,303 | 59,519 | 59,755 | 58,818 | 52,061 |
| 2023 | 47,224 | 39,096 | 36,527 | 39,128 | 45,481 | 49,442 | 56,699 | 62,753 | 64,254 | 62,478 | 56,300 | 49,616 |
| 2024 | 40,569 | |||||||||||
| - = No Data Reported; -- = Not Applicable; NA = Not Available; W = Withheld to avoid disclosure of individual company data. |
| Release Date: 3/29/2024 |
| Next Release Date: 4/30/2024 |