|
Download Data (XLS File) |
|
||||||||
|
||||||||
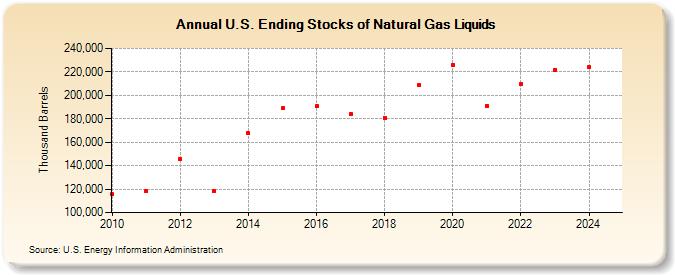
| U.S. Ending Stocks of Natural Gas Liquids (Thousand Barrels) | ||||||||
| Decade | Year-0 | Year-1 | Year-2 | Year-3 | Year-4 | Year-5 | Year-6 | Year-7 | Year-8 | Year-9 |
|---|---|---|---|---|---|---|---|---|---|---|
| 2010's | 115,463 | 118,524 | 145,506 | 118,743 | 167,441 | 188,879 | 190,771 | 184,131 | 180,861 | 208,730 |
| 2020's | 225,919 | 190,969 | 209,277 | 221,962 |
| - = No Data Reported; -- = Not Applicable; NA = Not Available; W = Withheld to avoid disclosure of individual company data. |
| Release Date: 3/29/2024 |
| Next Release Date: 8/30/2024 |