|
Download Data (XLS File) |
|
||||||||
|
||||||||
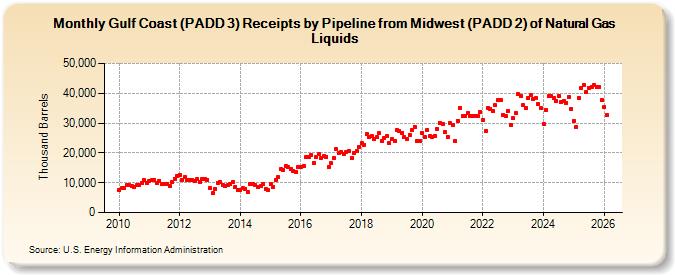
| Gulf Coast (PADD 3) Receipts by Pipeline from Midwest (PADD 2) of Natural Gas Liquids (Thousand Barrels) | ||||||||
| Year | Jan | Feb | Mar | Apr | May | Jun | Jul | Aug | Sep | Oct | Nov | Dec |
|---|---|---|---|---|---|---|---|---|---|---|---|---|
| 2010 | 7,587 | 8,142 | 8,282 | 9,099 | 9,096 | 8,838 | 8,474 | 9,178 | 9,167 | 9,927 | 10,762 | 9,982 |
| 2011 | 10,616 | 10,830 | 10,929 | 9,845 | 10,670 | 9,648 | 9,440 | 9,576 | 8,936 | 10,321 | 11,366 | 12,420 |
| 2012 | 12,677 | 10,989 | 11,871 | 10,865 | 11,002 | 10,879 | 10,487 | 11,114 | 10,342 | 11,306 | 11,207 | 11,014 |
| 2013 | 8,173 | 6,483 | 8,007 | 10,046 | 10,301 | 9,233 | 9,043 | 9,152 | 9,740 | 10,088 | 8,664 | 7,571 |
| 2014 | 7,597 | 8,199 | 7,819 | 6,792 | 9,723 | 9,497 | 9,157 | 8,726 | 8,831 | 9,526 | 7,934 | 7,566 |
| 2015 | 9,585 | 8,739 | 10,855 | 11,865 | 14,491 | 14,328 | 15,766 | 15,268 | 14,636 | 14,040 | 13,604 | 15,323 |
| 2016 | 15,437 | 15,538 | 18,524 | 18,643 | 19,345 | 16,745 | 18,717 | 19,492 | 18,442 | 18,909 | 18,745 | 15,446 |
| 2017 | 16,474 | 18,290 | 21,158 | 20,117 | 20,446 | 19,570 | 20,227 | 20,704 | 18,351 | 20,097 | 20,726 | 22,119 |
| 2018 | 23,165 | 22,702 | 26,195 | 25,219 | 25,754 | 24,799 | 25,207 | 26,597 | 24,116 | 25,150 | 25,529 | 23,286 |
| 2019 | 24,656 | 23,975 | 27,739 | 27,286 | 26,794 | 25,314 | 24,668 | 26,045 | 27,795 | 28,678 | 23,942 | 24,135 |
| 2020 | 26,774 | 25,492 | 27,708 | 25,618 | 25,501 | 25,677 | 28,093 | 30,104 | 29,813 | 26,928 | 25,483 | 29,998 |
| 2021 | 29,353 | 24,058 | 30,840 | 35,133 | 32,380 | 32,535 | 33,353 | 32,469 | 32,465 | 32,504 | 32,323 | 33,758 |
| 2022 | 31,069 | 27,414 | 35,138 | 34,726 | 34,037 | 35,913 | 37,586 | 37,775 | 32,873 | 32,342 | 34,009 | 29,518 |
| 2023 | 31,586 | 33,392 | 39,746 | 39,008 | 36,046 | 35,081 | 38,546 | 39,415 | 37,983 | 38,370 | 36,436 | 34,923 |
| 2024 | 29,741 | |||||||||||
| - = No Data Reported; -- = Not Applicable; NA = Not Available; W = Withheld to avoid disclosure of individual company data. |
| Release Date: 3/29/2024 |
| Next Release Date: 4/30/2024 |