|
Download Data (XLS File) |
|
||||||||
|
||||||||
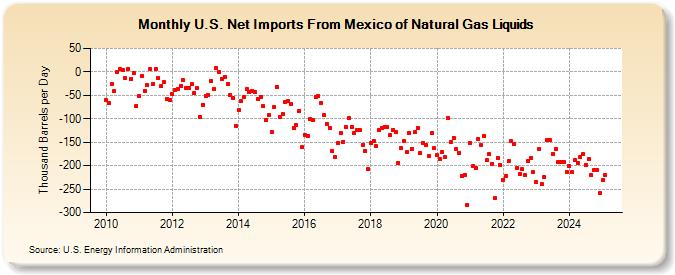
| U.S. Net Imports From Mexico of Natural Gas Liquids (Thousand Barrels per Day) | ||||||||
| Year | Jan | Feb | Mar | Apr | May | Jun | Jul | Aug | Sep | Oct | Nov | Dec |
|---|---|---|---|---|---|---|---|---|---|---|---|---|
| 2010 | -61 | -67 | -25 | -41 | -1 | 5 | 4 | -14 | 5 | -15 | -2 | -72 |
| 2011 | -52 | -8 | -40 | -27 | 5 | -25 | 6 | -13 | -31 | -22 | -57 | -59 |
| 2012 | -48 | -38 | -36 | -30 | -18 | -34 | -34 | -26 | -45 | -35 | -96 | -70 |
| 2013 | -51 | -49 | -19 | -37 | 8 | 0 | -15 | -10 | -26 | -50 | -55 | -115 |
| 2014 | -81 | -63 | -53 | -37 | -43 | -40 | -43 | -58 | -54 | -73 | -102 | -93 |
| 2015 | -128 | -76 | -32 | -97 | -90 | -64 | -62 | -68 | -120 | -114 | -83 | -161 |
| 2016 | -134 | -137 | -101 | -103 | -53 | -52 | -66 | -93 | -111 | -119 | -169 | -182 |
| 2017 | -151 | -130 | -149 | -117 | -99 | -117 | -130 | -125 | -125 | -156 | -168 | -208 |
| 2018 | -151 | -147 | -159 | -124 | -120 | -117 | -118 | -135 | -123 | -128 | -194 | -163 |
| 2019 | -147 | -170 | -130 | -164 | -129 | -119 | -173 | -151 | -156 | -180 | -131 | -163 |
| 2020 | -178 | -186 | -171 | -182 | -98 | -150 | -140 | -164 | -172 | -222 | -219 | -284 |
| 2021 | -151 | -201 | -205 | -143 | -157 | -137 | -189 | -176 | -196 | -269 | -183 | -198 |
| 2022 | -230 | -222 | -190 | -148 | -154 | -204 | -218 | -208 | -220 | -190 | -183 | -213 |
| 2023 | -225 | -171 | -270 | -202 | -145 | -145 | -176 | -164 | -192 | -192 | -192 | -214 |
| 2024 | -201 | |||||||||||
| - = No Data Reported; -- = Not Applicable; NA = Not Available; W = Withheld to avoid disclosure of individual company data. |
| Release Date: 3/29/2024 |
| Next Release Date: 4/30/2024 |