|
Download Data (XLS File) |
|
||||||||
|
||||||||
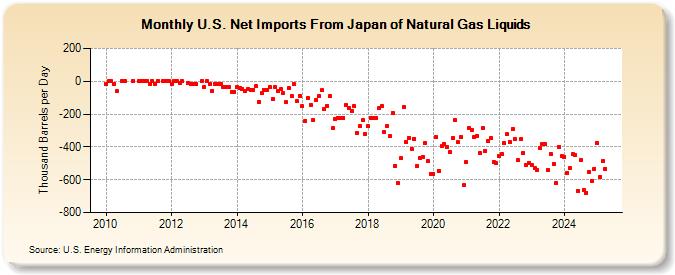
| U.S. Net Imports From Japan of Natural Gas Liquids (Thousand Barrels per Day) | ||||||||
| Year | Jan | Feb | Mar | Apr | May | Jun | Jul | Aug | Sep | Oct | Nov | Dec |
|---|---|---|---|---|---|---|---|---|---|---|---|---|
| 2010 | -17 | 0 | 0 | -18 | -62 | 0 | 0 | 0 | ||||
| 2011 | 0 | 0 | 0 | 0 | -14 | 0 | -15 | 0 | 0 | 0 | 0 | |
| 2012 | -18 | 0 | 0 | -9 | 0 | -8 | -18 | -18 | -18 | 0 | ||
| 2013 | -36 | 0 | -17 | -57 | -17 | -19 | -19 | -35 | -38 | -37 | -63 | -63 |
| 2014 | -36 | -39 | -45 | -57 | -49 | -51 | -52 | -32 | -125 | -73 | -51 | -54 |
| 2015 | -37 | -111 | -37 | -59 | -49 | -72 | -129 | -43 | -90 | -17 | -123 | -90 |
| 2016 | -153 | -240 | -105 | -142 | -238 | -112 | -92 | -55 | -169 | -148 | -93 | -287 |
| 2017 | -230 | -222 | -226 | -225 | -144 | -164 | -184 | -153 | -315 | -275 | -239 | -324 |
| 2018 | -275 | -222 | -226 | -223 | -166 | -153 | -310 | -275 | -335 | -193 | -515 | -620 |
| 2019 | -470 | -156 | -368 | -346 | -410 | -350 | -516 | -465 | -461 | -375 | -486 | -563 |
| 2020 | -563 | -340 | -544 | -396 | -382 | -398 | -429 | -346 | -237 | -373 | -339 | -634 |
| 2021 | -493 | -285 | -298 | -339 | -332 | -436 | -287 | -425 | -367 | -346 | -491 | -497 |
| 2022 | -456 | -443 | -378 | -324 | -370 | -290 | -352 | -482 | -354 | -438 | -511 | -497 |
| 2023 | -553 | -570 | -571 | -385 | -382 | -432 | -572 | -500 | -555 | -654 | -458 | -503 |
| 2024 | -460 | |||||||||||
| - = No Data Reported; -- = Not Applicable; NA = Not Available; W = Withheld to avoid disclosure of individual company data. |
| Release Date: 3/29/2024 |
| Next Release Date: 4/30/2024 |