|
Download Data (XLS File) |
|
||||||||
|
||||||||
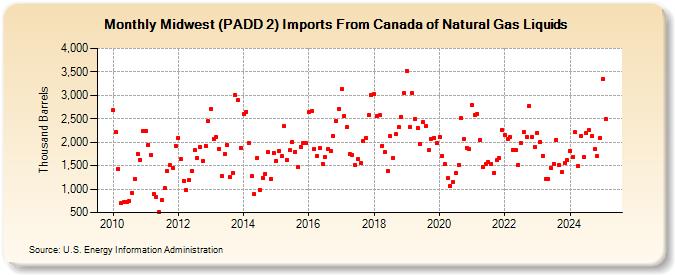
| Midwest (PADD 2) Imports From Canada of Natural Gas Liquids (Thousand Barrels) | ||||||||
| Year | Jan | Feb | Mar | Apr | May | Jun | Jul | Aug | Sep | Oct | Nov | Dec |
|---|---|---|---|---|---|---|---|---|---|---|---|---|
| 2010 | 2,678 | 2,214 | 1,430 | 695 | 715 | 734 | 746 | 925 | 1,226 | 1,759 | 1,630 | 2,232 |
| 2011 | 2,234 | 1,946 | 1,733 | 891 | 829 | 515 | 770 | 1,014 | 1,376 | 1,504 | 1,452 | 1,920 |
| 2012 | 2,091 | 1,633 | 1,183 | 976 | 1,191 | 1,385 | 1,830 | 1,666 | 1,898 | 1,595 | 1,924 | 2,446 |
| 2013 | 2,708 | 2,074 | 2,106 | 1,862 | 1,288 | 1,752 | 1,939 | 1,255 | 1,344 | 2,997 | 2,891 | 1,880 |
| 2014 | 2,602 | 2,653 | 1,979 | 1,274 | 892 | 1,670 | 989 | 1,232 | 1,330 | 1,786 | 1,224 | 1,780 |
| 2015 | 1,595 | 1,821 | 1,697 | 2,337 | 1,625 | 1,828 | 2,002 | 1,800 | 1,464 | 1,903 | 1,991 | 1,976 |
| 2016 | 2,636 | 2,665 | 1,849 | 1,714 | 1,869 | 1,541 | 1,686 | 1,857 | 1,820 | 2,135 | 2,458 | 2,718 |
| 2017 | 3,141 | 2,563 | 2,318 | 1,747 | 1,731 | 1,504 | 1,636 | 1,546 | 2,027 | 2,100 | 2,570 | 2,997 |
| 2018 | 3,018 | 2,568 | 2,570 | 1,925 | 1,785 | 1,389 | 2,130 | 1,672 | 2,165 | 2,321 | 2,538 | 3,054 |
| 2019 | 3,518 | 2,316 | 3,050 | 2,495 | 2,303 | 1,964 | 2,423 | 2,336 | 1,825 | 2,076 | 2,095 | 1,975 |
| 2020 | 2,110 | 1,708 | 1,533 | 1,234 | 1,069 | 1,149 | 1,341 | 1,520 | 2,515 | 2,059 | 1,886 | 1,845 |
| 2021 | 2,790 | 2,585 | 2,608 | 2,055 | 1,472 | 1,537 | 1,580 | 1,539 | 1,345 | 1,615 | 1,662 | 2,269 |
| 2022 | 2,155 | 2,072 | 2,108 | 1,839 | 1,832 | 1,515 | 1,986 | 2,222 | 2,121 | 2,773 | 2,118 | 1,903 |
| 2023 | 2,202 | 1,997 | 1,709 | 1,218 | 1,222 | 1,446 | 1,543 | 2,046 | 1,510 | 1,356 | 1,561 | 1,610 |
| 2024 | 1,819 | |||||||||||
| - = No Data Reported; -- = Not Applicable; NA = Not Available; W = Withheld to avoid disclosure of individual company data. |
| Release Date: 3/29/2024 |
| Next Release Date: 4/30/2024 |