|
Download Data (XLS File) |
|
||||||||
|
||||||||
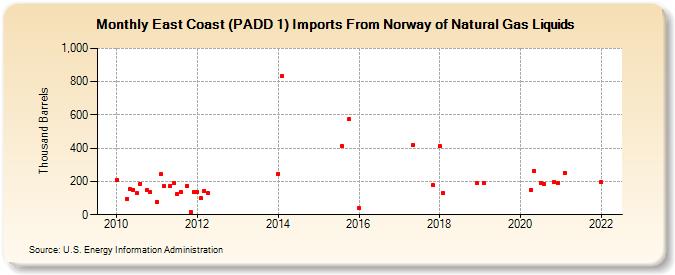
| East Coast (PADD 1) Imports From Norway of Natural Gas Liquids (Thousand Barrels) | ||||||||
| Year | Jan | Feb | Mar | Apr | May | Jun | Jul | Aug | Sep | Oct | Nov | Dec |
|---|---|---|---|---|---|---|---|---|---|---|---|---|
| 2010 | 209 | 96 | 154 | 150 | 128 | 187 | 146 | 136 | ||||
| 2011 | 79 | 242 | 171 | 175 | 190 | 126 | 139 | 173 | 19 | 139 | ||
| 2012 | 139 | 101 | 145 | 131 | ||||||||
| 2014 | 247 | 832 | ||||||||||
| 2015 | 411 | 573 | ||||||||||
| 2016 | 43 | |||||||||||
| 2017 | 419 | 177 | ||||||||||
| 2018 | 411 | 129 | 192 | |||||||||
| 2019 | 192 | |||||||||||
| 2020 | 151 | 265 | 192 | 186 | 198 | 191 | ||||||
| 2021 | 253 | |||||||||||
| 2022 | 196 | |||||||||||
| - = No Data Reported; -- = Not Applicable; NA = Not Available; W = Withheld to avoid disclosure of individual company data. |
| Release Date: 3/29/2024 |
| Next Release Date: 4/30/2024 |