|
Download Data (XLS File) |
|
||||||||
|
||||||||
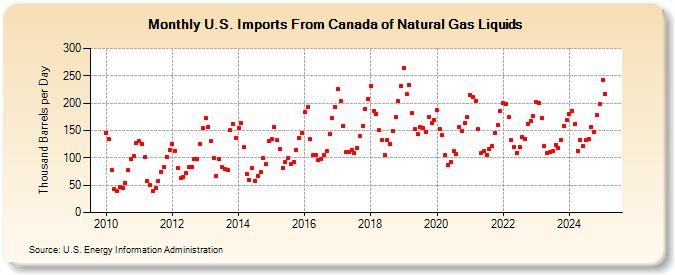
| U.S. Imports From Canada of Natural Gas Liquids (Thousand Barrels per Day) | ||||||||
| Year | Jan | Feb | Mar | Apr | May | Jun | Jul | Aug | Sep | Oct | Nov | Dec |
|---|---|---|---|---|---|---|---|---|---|---|---|---|
| 2010 | 146 | 134 | 78 | 43 | 40 | 46 | 44 | 54 | 77 | 97 | 103 | 127 |
| 2011 | 130 | 125 | 101 | 57 | 50 | 39 | 45 | 57 | 75 | 84 | 102 | 114 |
| 2012 | 126 | 113 | 82 | 63 | 65 | 73 | 83 | 84 | 98 | 97 | 125 | 154 |
| 2013 | 173 | 157 | 130 | 100 | 67 | 97 | 83 | 79 | 78 | 150 | 161 | 136 |
| 2014 | 155 | 163 | 119 | 71 | 60 | 81 | 57 | 67 | 74 | 99 | 89 | 130 |
| 2015 | 134 | 156 | 132 | 116 | 81 | 93 | 100 | 89 | 93 | 114 | 136 | 146 |
| 2016 | 183 | 193 | 134 | 106 | 105 | 96 | 98 | 105 | 112 | 144 | 172 | 193 |
| 2017 | 226 | 203 | 159 | 110 | 110 | 114 | 109 | 118 | 139 | 159 | 190 | 208 |
| 2018 | 232 | 186 | 181 | 150 | 133 | 106 | 133 | 125 | 149 | 174 | 203 | 232 |
| 2019 | 265 | 216 | 234 | 182 | 152 | 143 | 157 | 154 | 147 | 175 | 164 | 170 |
| 2020 | 188 | 153 | 141 | 106 | 86 | 93 | 112 | 107 | 156 | 149 | 164 | 175 |
| 2021 | 215 | 212 | 203 | 152 | 109 | 112 | 106 | 117 | 121 | 145 | 160 | 185 |
| 2022 | 200 | 199 | 174 | 132 | 120 | 109 | 120 | 138 | 134 | 162 | 168 | 177 |
| 2023 | 199 | 198 | 174 | 116 | 108 | 110 | 111 | 124 | 118 | 134 | 158 | 169 |
| 2024 | 180 | |||||||||||
| - = No Data Reported; -- = Not Applicable; NA = Not Available; W = Withheld to avoid disclosure of individual company data. |
| Release Date: 3/29/2024 |
| Next Release Date: 4/30/2024 |