|
Download Data (XLS File) |
|
||||||||
|
||||||||
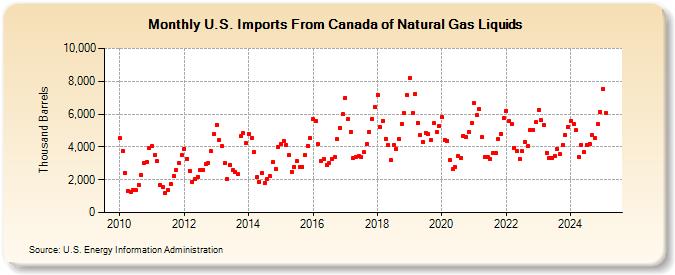
| U.S. Imports From Canada of Natural Gas Liquids (Thousand Barrels) | ||||||||
| Year | Jan | Feb | Mar | Apr | May | Jun | Jul | Aug | Sep | Oct | Nov | Dec |
|---|---|---|---|---|---|---|---|---|---|---|---|---|
| 2010 | 4,531 | 3,743 | 2,427 | 1,286 | 1,230 | 1,387 | 1,358 | 1,686 | 2,317 | 3,014 | 3,094 | 3,948 |
| 2011 | 4,032 | 3,502 | 3,120 | 1,709 | 1,554 | 1,178 | 1,386 | 1,752 | 2,235 | 2,602 | 3,049 | 3,521 |
| 2012 | 3,892 | 3,269 | 2,542 | 1,880 | 2,017 | 2,188 | 2,587 | 2,608 | 2,943 | 3,009 | 3,739 | 4,784 |
| 2013 | 5,349 | 4,409 | 4,024 | 2,991 | 2,068 | 2,908 | 2,564 | 2,456 | 2,327 | 4,647 | 4,823 | 4,217 |
| 2014 | 4,800 | 4,554 | 3,698 | 2,141 | 1,851 | 2,423 | 1,776 | 2,074 | 2,211 | 3,075 | 2,666 | 4,023 |
| 2015 | 4,164 | 4,380 | 4,102 | 3,481 | 2,497 | 2,794 | 3,112 | 2,770 | 2,780 | 3,523 | 4,079 | 4,516 |
| 2016 | 5,671 | 5,588 | 4,149 | 3,171 | 3,254 | 2,893 | 3,028 | 3,266 | 3,355 | 4,462 | 5,171 | 5,979 |
| 2017 | 7,001 | 5,694 | 4,936 | 3,313 | 3,405 | 3,426 | 3,367 | 3,663 | 4,168 | 4,925 | 5,703 | 6,436 |
| 2018 | 7,189 | 5,200 | 5,604 | 4,503 | 4,109 | 3,186 | 4,117 | 3,878 | 4,469 | 5,395 | 6,075 | 7,190 |
| 2019 | 8,212 | 6,059 | 7,241 | 5,464 | 4,722 | 4,303 | 4,864 | 4,782 | 4,407 | 5,435 | 4,916 | 5,265 |
| 2020 | 5,820 | 4,425 | 4,380 | 3,190 | 2,660 | 2,779 | 3,472 | 3,322 | 4,674 | 4,613 | 4,913 | 5,425 |
| 2021 | 6,661 | 5,923 | 6,302 | 4,574 | 3,377 | 3,366 | 3,283 | 3,639 | 3,634 | 4,485 | 4,787 | 5,734 |
| 2022 | 6,201 | 5,564 | 5,382 | 3,955 | 3,722 | 3,260 | 3,732 | 4,283 | 4,025 | 5,028 | 5,054 | 5,496 |
| 2023 | 6,168 | 5,556 | 5,383 | 3,488 | 3,362 | 3,314 | 3,451 | 3,857 | 3,550 | 4,158 | 4,736 | 5,238 |
| 2024 | 5,569 | |||||||||||
| - = No Data Reported; -- = Not Applicable; NA = Not Available; W = Withheld to avoid disclosure of individual company data. |
| Release Date: 3/29/2024 |
| Next Release Date: 4/30/2024 |