|
Download Data (XLS File) |
|
||||||||
|
||||||||
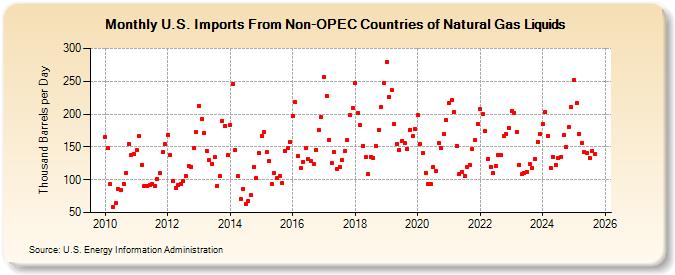
| U.S. Imports From Non-OPEC Countries of Natural Gas Liquids (Thousand Barrels per Day) | ||||||||
| Year | Jan | Feb | Mar | Apr | May | Jun | Jul | Aug | Sep | Oct | Nov | Dec |
|---|---|---|---|---|---|---|---|---|---|---|---|---|
| 2010 | 165 | 148 | 93 | 59 | 64 | 86 | 85 | 94 | 110 | 155 | 138 | 139 |
| 2011 | 145 | 166 | 123 | 91 | 90 | 92 | 94 | 91 | 101 | 110 | 142 | 154 |
| 2012 | 168 | 138 | 98 | 88 | 92 | 94 | 98 | 106 | 121 | 120 | 148 | 172 |
| 2013 | 213 | 193 | 171 | 144 | 130 | 124 | 134 | 91 | 105 | 190 | 182 | 137 |
| 2014 | 184 | 246 | 145 | 105 | 71 | 86 | 63 | 68 | 76 | 120 | 102 | 140 |
| 2015 | 167 | 172 | 142 | 128 | 94 | 110 | 102 | 105 | 95 | 144 | 148 | 158 |
| 2016 | 197 | 218 | 136 | 118 | 127 | 149 | 131 | 129 | 124 | 146 | 175 | 195 |
| 2017 | 256 | 228 | 161 | 125 | 142 | 117 | 119 | 130 | 143 | 161 | 198 | 209 |
| 2018 | 247 | 202 | 184 | 152 | 134 | 108 | 135 | 133 | 151 | 176 | 211 | 247 |
| 2019 | 280 | 226 | 236 | 185 | 155 | 145 | 159 | 156 | 147 | 176 | 166 | 178 |
| 2020 | 198 | 154 | 141 | 111 | 94 | 93 | 120 | 113 | 156 | 149 | 170 | 191 |
| 2021 | 217 | 221 | 203 | 152 | 109 | 112 | 106 | 120 | 123 | 147 | 160 | 185 |
| 2022 | 208 | 200 | 174 | 132 | 120 | 110 | 121 | 138 | 137 | 166 | 170 | 179 |
| 2023 | 202 | 200 | 174 | 118 | 108 | 110 | 111 | 124 | 118 | 134 | 158 | 169 |
| 2024 | 180 | |||||||||||
| - = No Data Reported; -- = Not Applicable; NA = Not Available; W = Withheld to avoid disclosure of individual company data. |
| Release Date: 3/29/2024 |
| Next Release Date: 4/30/2024 |