|
Download Data (XLS File) |
|
||||||||
|
||||||||
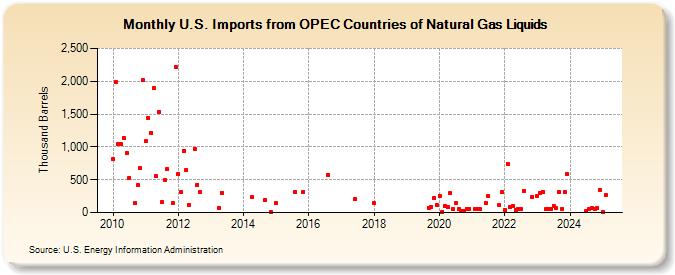
| U.S. Imports from OPEC Countries of Natural Gas Liquids (Thousand Barrels) | ||||||||
| Year | Jan | Feb | Mar | Apr | May | Jun | Jul | Aug | Sep | Oct | Nov | Dec |
|---|---|---|---|---|---|---|---|---|---|---|---|---|
| 2010 | 813 | 1,986 | 1,038 | 1,040 | 1,141 | 906 | 528 | 142 | 416 | 677 | 2,013 | |
| 2011 | 1,083 | 1,445 | 1,218 | 1,904 | 550 | 1,536 | 164 | 499 | 662 | 150 | 2,214 | |
| 2012 | 590 | 311 | 938 | 650 | 121 | 974 | 423 | 306 | ||||
| 2013 | 73 | 302 | ||||||||||
| 2014 | 233 | 185 | 13 | |||||||||
| 2015 | 149 | 320 | 320 | |||||||||
| 2016 | 577 | |||||||||||
| 2017 | 199 | |||||||||||
| 2018 | 140 | |||||||||||
| 2019 | 74 | 90 | 224 | 109 | ||||||||
| 2020 | 259 | 10 | 100 | 80 | 293 | 47 | 149 | 56 | 26 | 29 | 56 | 55 |
| 2021 | 54 | 57 | 54 | 144 | 245 | 110 | 311 | |||||
| 2022 | 43 | 746 | 78 | 97 | 45 | 49 | 53 | 334 | 237 | |||
| 2023 | 257 | 300 | 318 | 49 | 53 | 57 | 103 | 65 | 316 | 55 | 312 | 581 |
| - = No Data Reported; -- = Not Applicable; NA = Not Available; W = Withheld to avoid disclosure of individual company data. |
| Release Date: 3/29/2024 |
| Next Release Date: 4/30/2024 |