|
Download Data (XLS File) |
|
||||||||
|
||||||||
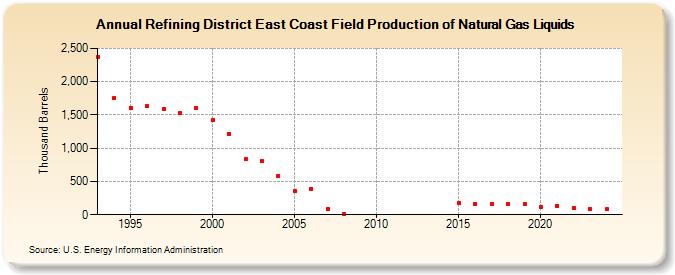
| Refining District East Coast Field Production of Natural Gas Liquids (Thousand Barrels) | ||||||||
| Decade | Year-0 | Year-1 | Year-2 | Year-3 | Year-4 | Year-5 | Year-6 | Year-7 | Year-8 | Year-9 |
|---|---|---|---|---|---|---|---|---|---|---|
| 1990's | 2,372 | 1,756 | 1,611 | 1,630 | 1,596 | 1,536 | 1,602 | |||
| 2000's | 1,423 | 1,220 | 833 | 806 | 587 | 359 | 394 | 88 | 16 | |
| 2010's | 175 | 165 | 154 | 157 | 156 | |||||
| 2020's | 119 | 130 | 108 | 90 |
| - = No Data Reported; -- = Not Applicable; NA = Not Available; W = Withheld to avoid disclosure of individual company data. |
| Release Date: 3/29/2024 |
| Next Release Date: 8/30/2024 |