|
Download Data (XLS File) |
|
||||||||
|
||||||||
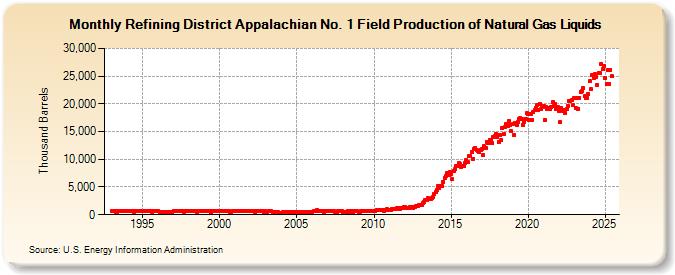
| Refining District Appalachian No. 1 Field Production of Natural Gas Liquids (Thousand Barrels) | ||||||||
| Year | Jan | Feb | Mar | Apr | May | Jun | Jul | Aug | Sep | Oct | Nov | Dec |
|---|---|---|---|---|---|---|---|---|---|---|---|---|
| 1993 | 689 | 615 | 659 | 527 | 510 | 652 | 635 | 674 | 665 | 708 | 690 | 675 |
| 1994 | 595 | 620 | 675 | 640 | 622 | 565 | 672 | 590 | 712 | 735 | 696 | 643 |
| 1995 | 675 | 596 | 701 | 675 | 670 | 691 | 650 | 483 | 673 | 716 | 689 | 658 |
| 1996 | 615 | 475 | 523 | 538 | 481 | 482 | 503 | 223 | 545 | 564 | 546 | 553 |
| 1997 | 634 | 599 | 693 | 663 | 590 | 664 | 690 | 703 | 571 | 703 | 683 | 657 |
| 1998 | 689 | 635 | 693 | 647 | 660 | 670 | 500 | 718 | 672 | 701 | 747 | 696 |
| 1999 | 666 | 626 | 679 | 677 | 663 | 310 | 671 | 695 | 674 | 736 | 707 | 689 |
| 2000 | 680 | 636 | 735 | 699 | 710 | 693 | 731 | 733 | 542 | 505 | 691 | 669 |
| 2001 | 634 | 594 | 706 | 670 | 655 | 691 | 711 | 707 | 693 | 732 | 708 | 700 |
| 2002 | 660 | 601 | 627 | 570 | 620 | 592 | 666 | 655 | 604 | 642 | 574 | 643 |
| 2003 | 459 | 522 | 614 | 592 | 644 | 500 | 267 | 322 | 491 | 537 | 315 | 331 |
| 2004 | 331 | 438 | 499 | 529 | 525 | 530 | 477 | 543 | 414 | 567 | 535 | 535 |
| 2005 | 497 | 378 | 512 | 469 | 513 | 505 | 416 | 527 | 529 | 537 | 505 | 526 |
| 2006 | 558 | 592 | 654 | 617 | 815 | 740 | 723 | 588 | 590 | 525 | 606 | 617 |
| 2007 | 607 | 597 | 651 | 652 | 680 | 586 | 579 | 538 | 583 | 583 | 582 | 586 |
| 2008 | 562 | 537 | 574 | 520 | 584 | 557 | 591 | 587 | 453 | 601 | 583 | 586 |
| 2009 | 574 | 530 | 617 | 599 | 597 | 591 | 641 | 653 | 590 | 679 | 644 | 650 |
| 2010 | 738 | 677 | 817 | 774 | 819 | 826 | 864 | 850 | 683 | 806 | 944 | 894 |
| 2011 | 896 | 878 | 1,015 | 998 | 1,060 | 1,070 | 1,157 | 1,126 | 1,103 | 1,143 | 1,196 | 1,349 |
| 2012 | 1,314 | 1,209 | 1,265 | 1,214 | 1,309 | 1,311 | 1,262 | 1,420 | 1,399 | 1,491 | 1,622 | 1,732 |
| 2013 | 1,732 | 1,766 | 2,043 | 2,315 | 2,564 | 2,742 | 2,958 | 2,913 | 2,791 | 2,956 | 3,171 | 3,680 |
| 2014 | 4,181 | 4,419 | 5,212 | 4,766 | 5,212 | 5,171 | 5,930 | 6,593 | 6,956 | 7,525 | 7,109 | 7,733 |
| 2015 | 7,374 | 6,364 | 7,903 | 8,215 | 8,796 | 8,773 | 9,283 | 9,073 | 8,659 | 8,734 | 8,705 | 9,347 |
| 2016 | 9,868 | 9,443 | 10,602 | 10,609 | 11,241 | 10,128 | 11,815 | 11,987 | 11,647 | 11,535 | 11,260 | 11,738 |
| 2017 | 11,890 | 10,724 | 12,325 | 12,095 | 13,173 | 12,896 | 13,503 | 13,430 | 12,938 | 14,044 | 14,138 | 14,646 |
| 2018 | 13,997 | 13,128 | 14,416 | 13,405 | 15,576 | 14,489 | 15,765 | 16,383 | 16,083 | 16,876 | 16,199 | 15,044 |
| 2019 | 16,334 | 14,433 | 16,589 | 16,266 | 16,779 | 17,354 | 17,459 | 17,279 | 16,270 | 16,809 | 17,302 | 18,276 |
| 2020 | 18,171 | 17,147 | 18,253 | 17,097 | 18,455 | 18,847 | 19,278 | 19,734 | 18,964 | 19,978 | 19,000 | 19,461 |
| 2021 | 19,676 | 17,101 | 19,487 | 19,113 | 19,294 | 19,094 | 19,454 | 20,247 | 19,664 | 20,053 | 19,063 | 19,453 |
| 2022 | 18,632 | 16,695 | 19,222 | 18,797 | 18,919 | 18,430 | 19,130 | 19,631 | 20,544 | 20,572 | 20,718 | 19,713 |
| 2023 | 20,817 | 19,468 | 20,859 | 20,395 | 20,725 | 21,838 | 22,103 | 22,623 | 21,198 | 21,004 | 21,081 | 21,781 |
| 2024 | 22,159 | |||||||||||
| - = No Data Reported; -- = Not Applicable; NA = Not Available; W = Withheld to avoid disclosure of individual company data. |
| Release Date: 3/29/2024 |
| Next Release Date: 4/30/2024 |