|
Download Data (XLS File) |
|
||||||||
|
||||||||
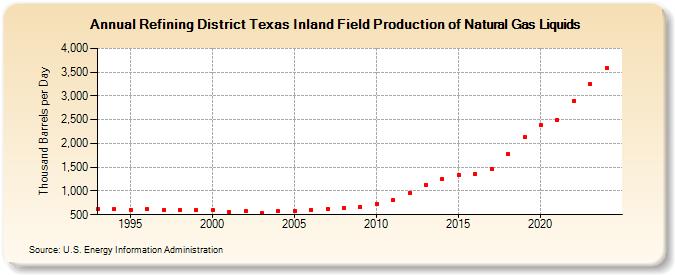
| Refining District Texas Inland Field Production of Natural Gas Liquids (Thousand Barrels per Day) | ||||||||
| Decade | Year-0 | Year-1 | Year-2 | Year-3 | Year-4 | Year-5 | Year-6 | Year-7 | Year-8 | Year-9 |
|---|---|---|---|---|---|---|---|---|---|---|
| 1990's | 621 | 615 | 608 | 617 | 605 | 605 | 591 | |||
| 2000's | 589 | 565 | 575 | 538 | 575 | 582 | 605 | 625 | 637 | 669 |
| 2010's | 730 | 806 | 958 | 1,132 | 1,256 | 1,346 | 1,356 | 1,464 | 1,779 | 2,132 |
| 2020's | 2,392 | 2,494 | 2,897 | 3,166 |
| - = No Data Reported; -- = Not Applicable; NA = Not Available; W = Withheld to avoid disclosure of individual company data. |
| Release Date: 3/29/2024 |
| Next Release Date: 8/30/2024 |