|
Download Data (XLS File) |
|
||||||||
|
||||||||
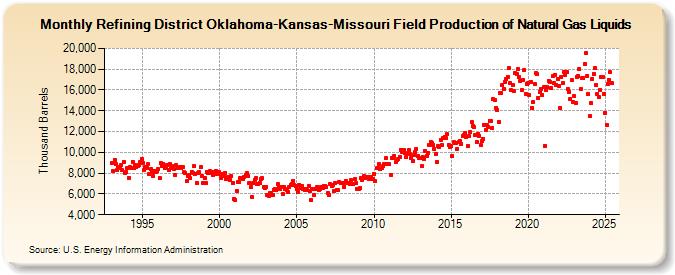
| Refining District Oklahoma-Kansas-Missouri Field Production of Natural Gas Liquids (Thousand Barrels) | ||||||||
| Year | Jan | Feb | Mar | Apr | May | Jun | Jul | Aug | Sep | Oct | Nov | Dec |
|---|---|---|---|---|---|---|---|---|---|---|---|---|
| 1993 | 8,940 | 8,180 | 9,277 | 8,898 | 8,326 | 8,575 | 8,458 | 8,772 | 8,278 | 9,106 | 8,022 | 8,137 |
| 1994 | 8,541 | 7,542 | 8,594 | 8,499 | 9,117 | 8,532 | 8,779 | 8,574 | 8,687 | 8,805 | 9,101 | 9,364 |
| 1995 | 8,995 | 8,296 | 8,586 | 8,498 | 8,832 | 7,933 | 8,366 | 8,071 | 7,717 | 8,232 | 8,073 | 8,218 |
| 1996 | 8,366 | 7,513 | 8,937 | 8,660 | 8,918 | 8,464 | 8,580 | 8,753 | 8,313 | 8,926 | 8,539 | 8,661 |
| 1997 | 8,437 | 7,836 | 8,750 | 8,468 | 8,497 | 8,625 | 8,461 | 8,564 | 8,107 | 8,008 | 7,218 | 7,742 |
| 1998 | 7,842 | 7,526 | 8,151 | 8,026 | 8,664 | 7,943 | 7,077 | 8,060 | 8,070 | 8,544 | 7,731 | 7,079 |
| 1999 | 7,510 | 7,054 | 8,110 | 8,023 | 8,172 | 7,990 | 8,147 | 7,836 | 8,000 | 8,218 | 7,903 | 8,136 |
| 2000 | 7,929 | 7,566 | 7,890 | 7,732 | 8,049 | 7,477 | 7,614 | 7,435 | 7,339 | 7,679 | 7,080 | 5,517 |
| 2001 | 5,375 | 6,296 | 7,133 | 7,167 | 7,559 | 7,549 | 7,467 | 7,642 | 7,826 | 8,034 | 7,699 | 7,062 |
| 2002 | 6,625 | 5,751 | 7,065 | 7,344 | 7,518 | 6,926 | 6,983 | 7,069 | 7,390 | 7,489 | 6,710 | 6,614 |
| 2003 | 6,678 | 5,853 | 5,847 | 6,045 | 6,099 | 5,913 | 6,382 | 6,512 | 6,390 | 6,953 | 6,635 | 6,482 |
| 2004 | 6,672 | 6,002 | 6,648 | 6,486 | 6,392 | 6,212 | 6,637 | 6,905 | 6,994 | 7,237 | 6,852 | 6,720 |
| 2005 | 6,460 | 6,209 | 6,883 | 6,578 | 6,777 | 6,517 | 6,404 | 6,438 | 6,401 | 6,777 | 6,316 | 5,414 |
| 2006 | 6,471 | 5,875 | 6,495 | 6,432 | 6,702 | 6,376 | 6,511 | 6,679 | 6,581 | 6,764 | 6,748 | 6,700 |
| 2007 | 6,128 | 5,856 | 6,966 | 6,717 | 6,894 | 6,283 | 7,005 | 6,424 | 6,383 | 7,127 | 7,081 | 7,008 |
| 2008 | 7,056 | 6,692 | 7,275 | 7,064 | 7,047 | 6,997 | 7,292 | 6,968 | 6,927 | 7,408 | 7,057 | 6,514 |
| 2009 | 6,451 | 6,553 | 7,548 | 7,342 | 7,716 | 7,559 | 7,611 | 7,667 | 7,431 | 7,528 | 7,586 | 7,402 |
| 2010 | 7,922 | 7,202 | 8,462 | 8,508 | 8,846 | 8,378 | 8,473 | 8,647 | 8,854 | 9,431 | 8,877 | 8,833 |
| 2011 | 8,862 | 7,837 | 9,457 | 9,419 | 9,686 | 9,038 | 9,220 | 9,403 | 9,582 | 10,252 | 10,069 | 10,181 |
| 2012 | 9,967 | 9,539 | 9,836 | 10,217 | 9,836 | 9,423 | 9,190 | 9,698 | 10,021 | 10,364 | 9,693 | 9,458 |
| 2013 | 9,490 | 8,693 | 9,584 | 9,377 | 10,096 | 9,652 | 9,966 | 10,699 | 11,014 | 10,937 | 10,746 | 10,356 |
| 2014 | 9,877 | 9,092 | 10,627 | 10,543 | 11,230 | 10,696 | 11,351 | 11,461 | 11,380 | 11,721 | 10,707 | 10,541 |
| 2015 | 10,634 | 9,640 | 10,964 | 10,862 | 10,931 | 10,364 | 10,962 | 11,127 | 10,821 | 11,559 | 11,691 | 11,880 |
| 2016 | 11,442 | 10,604 | 11,539 | 11,961 | 12,872 | 12,544 | 12,414 | 11,634 | 11,027 | 11,796 | 11,616 | 10,659 |
| 2017 | 11,049 | 11,297 | 12,636 | 12,124 | 12,638 | 12,448 | 13,051 | 13,055 | 12,370 | 15,112 | 15,001 | 14,304 |
| 2018 | 14,074 | 12,953 | 15,719 | 15,716 | 16,454 | 16,128 | 16,809 | 17,020 | 17,252 | 18,071 | 16,665 | 15,966 |
| 2019 | 16,432 | 15,916 | 17,639 | 17,562 | 18,020 | 17,274 | 16,858 | 15,968 | 16,984 | 17,897 | 15,644 | 16,615 |
| 2020 | 16,674 | 15,532 | 16,769 | 14,252 | 14,838 | 16,560 | 17,621 | 17,503 | 15,269 | 15,807 | 16,100 | 15,523 |
| 2021 | 16,247 | 10,616 | 16,015 | 16,241 | 16,854 | 16,801 | 16,166 | 17,302 | 16,713 | 17,467 | 16,483 | 17,070 |
| 2022 | 16,411 | 14,249 | 17,248 | 16,656 | 17,719 | 17,429 | 17,720 | 16,132 | 15,829 | 15,092 | 16,968 | 14,835 |
| 2023 | 15,100 | 14,499 | 16,964 | 17,108 | 18,211 | 16,108 | 17,095 | 17,315 | 18,662 | 19,697 | 17,385 | 15,592 |
| 2024 | 13,392 | |||||||||||
| - = No Data Reported; -- = Not Applicable; NA = Not Available; W = Withheld to avoid disclosure of individual company data. |
| Release Date: 3/29/2024 |
| Next Release Date: 4/30/2024 |