|
Download Data (XLS File) |
|
||||||||
|
||||||||
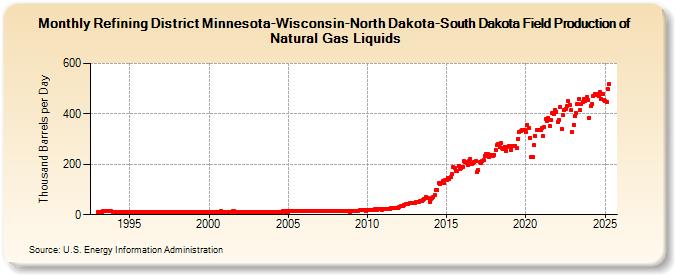
| Refining District Minnesota-Wisconsin-North Dakota-South Dakota Field Production of Natural Gas Liquids (Thousand Barrels per Day) | ||||||||
| Year | Jan | Feb | Mar | Apr | May | Jun | Jul | Aug | Sep | Oct | Nov | Dec |
|---|---|---|---|---|---|---|---|---|---|---|---|---|
| 1993 | 12 | 12 | 12 | 12 | 13 | 13 | 13 | 13 | 13 | 13 | 13 | 12 |
| 1994 | 11 | 12 | 11 | 12 | 12 | 12 | 12 | 12 | 12 | 12 | 12 | 11 |
| 1995 | 11 | 11 | 12 | 12 | 11 | 11 | 10 | 11 | 12 | 11 | 11 | 11 |
| 1996 | 10 | 10 | 9 | 11 | 11 | 10 | 11 | 11 | 11 | 11 | 10 | 9 |
| 1997 | 10 | 10 | 10 | 10 | 11 | 11 | 11 | 11 | 11 | 11 | 11 | 11 |
| 1998 | 10 | 10 | 10 | 11 | 11 | 11 | 11 | 11 | 11 | 12 | 12 | 11 |
| 1999 | 11 | 11 | 11 | 11 | 11 | 12 | 12 | 12 | 12 | 12 | 12 | 12 |
| 2000 | 11 | 11 | 12 | 12 | 12 | 12 | 12 | 12 | 12 | 13 | 12 | 12 |
| 2001 | 12 | 12 | 12 | 12 | 12 | 12 | 13 | 13 | 12 | 12 | 12 | 12 |
| 2002 | 11 | 12 | 11 | 12 | 12 | 12 | 12 | 12 | 12 | 12 | 12 | 12 |
| 2003 | 11 | 11 | 11 | 11 | 11 | 12 | 12 | 12 | 12 | 12 | 12 | 12 |
| 2004 | 12 | 12 | 12 | 12 | 12 | 12 | 12 | 12 | 13 | 13 | 12 | 13 |
| 2005 | 12 | 13 | 13 | 13 | 13 | 13 | 13 | 13 | 13 | 14 | 14 | 13 |
| 2006 | 13 | 13 | 13 | 13 | 13 | 13 | 14 | 15 | 15 | 15 | 14 | 14 |
| 2007 | 13 | 13 | 13 | 14 | 14 | 14 | 14 | 15 | 14 | 15 | 13 | 14 |
| 2008 | 14 | 13 | 13 | 14 | 14 | 15 | 15 | 15 | 15 | 16 | 16 | 11 |
| 2009 | 15 | 16 | 15 | 16 | 16 | 16 | 17 | 18 | 18 | 17 | 17 | 16 |
| 2010 | 17 | 17 | 18 | 19 | 20 | 19 | 22 | 20 | 23 | 22 | 22 | 20 |
| 2011 | 24 | 23 | 24 | 24 | 24 | 23 | 26 | 26 | 27 | 27 | 28 | 28 |
| 2012 | 30 | 33 | 35 | 33 | 40 | 43 | 42 | 43 | 45 | 46 | 47 | 48 |
| 2013 | 48 | 51 | 50 | 52 | 54 | 55 | 57 | 63 | 71 | 65 | 65 | 52 |
| 2014 | 63 | 67 | 72 | 77 | 99 | 100 | 124 | 120 | 127 | 133 | 125 | 137 |
| 2015 | 139 | 145 | 143 | 149 | 160 | 189 | 184 | 175 | 173 | 195 | 182 | 187 |
| 2016 | 191 | 212 | 210 | 205 | 199 | 215 | 221 | 202 | 205 | 210 | 213 | 168 |
| 2017 | 178 | 209 | 205 | 212 | 217 | 234 | 240 | 241 | 230 | 237 | 237 | 234 |
| 2018 | 237 | 257 | 275 | 280 | 269 | 283 | 264 | 262 | 270 | 254 | 268 | 273 |
| 2019 | 273 | 258 | 271 | 273 | 274 | 263 | 302 | 330 | 331 | 336 | 336 | 337 |
| 2020 | 328 | 357 | 345 | 306 | 229 | 230 | 275 | 313 | 336 | 337 | 338 | 335 |
| 2021 | 343 | 311 | 348 | 379 | 373 | 385 | 353 | 376 | 404 | 399 | 415 | 408 |
| 2022 | 366 | 375 | 428 | 342 | 395 | 416 | 420 | 430 | 450 | 437 | 414 | 330 |
| 2023 | 357 | 393 | 402 | 441 | 458 | 415 | 440 | 446 | 459 | 452 | 467 | 457 |
| 2024 | 385 | 430 | 440 | 471 | 478 | 480 | 473 | 471 | 486 | 458 | 477 | 457 |
| 2025 | 451 | 447 | 497 | 518 | ||||||||
| - = No Data Reported; -- = Not Applicable; NA = Not Available; W = Withheld to avoid disclosure of individual company data. |
| Release Date: 6/30/2025 |
| Next Release Date: 7/31/2025 |