|
Download Data (XLS File) |
|
||||||||
|
||||||||
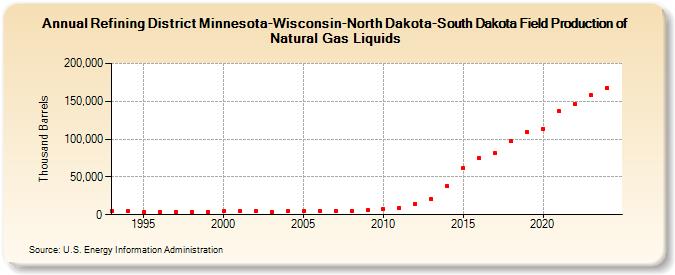
| Refining District Minnesota-Wisconsin-North Dakota-South Dakota Field Production of Natural Gas Liquids (Thousand Barrels) | ||||||||
| Decade | Year-0 | Year-1 | Year-2 | Year-3 | Year-4 | Year-5 | Year-6 | Year-7 | Year-8 | Year-9 |
|---|---|---|---|---|---|---|---|---|---|---|
| 1990's | 4,545 | 4,272 | 4,038 | 3,766 | 3,887 | 4,036 | 4,214 | |||
| 2000's | 4,367 | 4,475 | 4,351 | 4,232 | 4,457 | 4,786 | 5,026 | 5,009 | 5,195 | 5,993 |
| 2010's | 7,258 | 9,198 | 14,810 | 20,765 | 37,958 | 61,548 | 74,683 | 81,373 | 97,104 | 109,164 |
| 2020's | 113,735 | 136,775 | 146,103 | 159,481 |
| - = No Data Reported; -- = Not Applicable; NA = Not Available; W = Withheld to avoid disclosure of individual company data. |
| Release Date: 3/29/2024 |
| Next Release Date: 8/30/2024 |