|
Download Data (XLS File) |
|
||||||||
|
||||||||
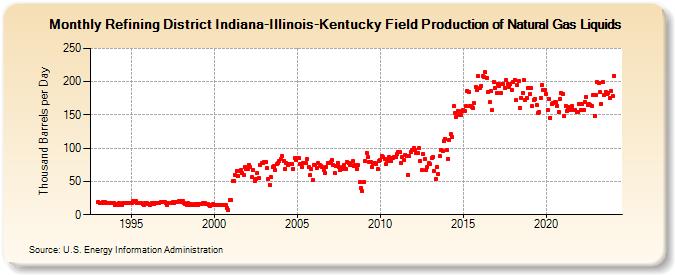
| Refining District Indiana-Illinois-Kentucky Field Production of Natural Gas Liquids (Thousand Barrels per Day) | ||||||||
| Year | Jan | Feb | Mar | Apr | May | Jun | Jul | Aug | Sep | Oct | Nov | Dec |
|---|---|---|---|---|---|---|---|---|---|---|---|---|
| 1993 | 19 | 18 | 18 | 19 | 18 | 19 | 18 | 18 | 17 | 17 | 17 | 17 |
| 1994 | 15 | 16 | 15 | 17 | 16 | 15 | 17 | 17 | 18 | 17 | 17 | 17 |
| 1995 | 18 | 20 | 19 | 20 | 18 | 17 | 17 | 17 | 16 | 15 | 17 | 17 |
| 1996 | 16 | 15 | 16 | 17 | 16 | 17 | 17 | 18 | 18 | 19 | 19 | 19 |
| 1997 | 19 | 18 | 14 | 18 | 17 | 18 | 19 | 18 | 19 | 19 | 20 | 20 |
| 1998 | 19 | 20 | 17 | 16 | 15 | 17 | 14 | 16 | 15 | 14 | 16 | 16 |
| 1999 | 15 | 16 | 16 | 16 | 17 | 17 | 16 | 16 | 15 | 13 | 14 | 16 |
| 2000 | 14 | 15 | 15 | 14 | 15 | 15 | 14 | 15 | 14 | 10 | 7 | 22 |
| 2001 | 22 | 50 | 50 | 60 | 66 | 58 | 65 | 67 | 62 | 60 | 72 | 69 |
| 2002 | 68 | 75 | 71 | 57 | 67 | 51 | 54 | 62 | 55 | 75 | 77 | 78 |
| 2003 | 79 | 79 | 70 | 53 | 45 | 56 | 72 | 73 | 67 | 76 | 77 | 80 |
| 2004 | 83 | 88 | 80 | 69 | 78 | 75 | 76 | 76 | 76 | 69 | 85 | 82 |
| 2005 | 85 | 85 | 76 | 72 | 77 | 77 | 78 | 83 | 71 | 59 | 69 | 52 |
| 2006 | 75 | 75 | 70 | 77 | 75 | 73 | 71 | 67 | 63 | 72 | 77 | 78 |
| 2007 | 79 | 82 | 75 | 62 | 73 | 78 | 71 | 67 | 69 | 72 | 74 | 69 |
| 2008 | 79 | 78 | 75 | 74 | 80 | 73 | 74 | 69 | 74 | 49 | 40 | 35 |
| 2009 | 49 | 81 | 93 | 86 | 79 | 79 | 72 | 77 | 77 | 76 | 69 | 81 |
| 2010 | 82 | 88 | 86 | 83 | 76 | 80 | 86 | 85 | 80 | 85 | 87 | 86 |
| 2011 | 91 | 95 | 95 | 78 | 87 | 82 | 90 | 88 | 60 | 88 | 95 | 98 |
| 2012 | 100 | 97 | 93 | 93 | 100 | 81 | 67 | 92 | 84 | 67 | 72 | 77 |
| 2013 | 76 | 85 | 86 | 66 | 54 | 72 | 61 | 88 | 98 | 96 | 111 | 114 |
| 2014 | 98 | 84 | 113 | 121 | 117 | 163 | 153 | 147 | 156 | 150 | 150 | 156 |
| 2015 | 158 | 156 | 163 | 186 | 184 | 164 | 162 | 160 | 168 | 192 | 187 | 208 |
| 2016 | 190 | 194 | 208 | 207 | 214 | 206 | 184 | 169 | 186 | 157 | 200 | 191 |
| 2017 | 183 | 197 | 194 | 183 | 196 | 197 | 191 | 202 | 197 | 192 | 196 | 188 |
| 2018 | 200 | 203 | 172 | 195 | 201 | 161 | 176 | 183 | 202 | 172 | 176 | 190 |
| 2019 | 181 | 191 | 163 | 172 | 174 | 165 | 153 | 155 | 176 | 195 | 188 | 188 |
| 2020 | 182 | 158 | 174 | 146 | 166 | 168 | 169 | 169 | 164 | 154 | 174 | 183 |
| 2021 | 181 | 149 | 164 | 156 | 162 | 157 | 159 | 163 | 158 | 158 | 155 | 154 |
| 2022 | 166 | 158 | 167 | 157 | 170 | 177 | 165 | 166 | 165 | 164 | 180 | 149 |
| 2023 | 180 | 199 | 198 | 184 | 167 | 199 | 180 | 185 | 181 | 183 | 176 | 186 |
| 2024 | 178 | 209 | 202 | 203 | ||||||||
| - = No Data Reported; -- = Not Applicable; NA = Not Available; W = Withheld to avoid disclosure of individual company data. |
| Release Date: 6/28/2024 |
| Next Release Date: 7/31/2024 |