|
Download Data (XLS File) |
|
||||||||
|
||||||||
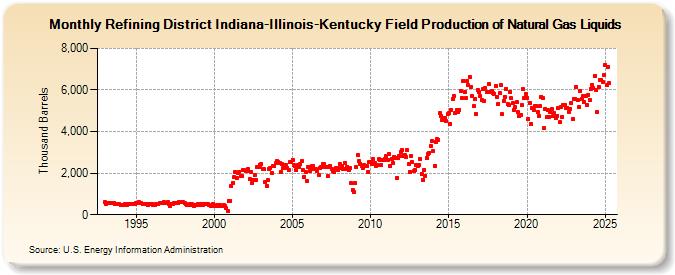
| Refining District Indiana-Illinois-Kentucky Field Production of Natural Gas Liquids (Thousand Barrels) | ||||||||
| Year | Jan | Feb | Mar | Apr | May | Jun | Jul | Aug | Sep | Oct | Nov | Dec |
|---|---|---|---|---|---|---|---|---|---|---|---|---|
| 1993 | 592 | 516 | 566 | 574 | 571 | 565 | 554 | 570 | 521 | 516 | 511 | 524 |
| 1994 | 453 | 444 | 471 | 516 | 493 | 457 | 512 | 512 | 530 | 538 | 523 | 512 |
| 1995 | 565 | 557 | 591 | 586 | 554 | 508 | 529 | 520 | 494 | 463 | 524 | 518 |
| 1996 | 505 | 448 | 488 | 514 | 498 | 508 | 541 | 555 | 554 | 600 | 577 | 575 |
| 1997 | 595 | 505 | 428 | 528 | 535 | 547 | 581 | 572 | 579 | 592 | 591 | 633 |
| 1998 | 599 | 546 | 527 | 470 | 450 | 496 | 447 | 498 | 441 | 444 | 478 | 507 |
| 1999 | 473 | 459 | 494 | 480 | 520 | 496 | 501 | 499 | 451 | 414 | 426 | 497 |
| 2000 | 431 | 422 | 452 | 427 | 464 | 435 | 433 | 455 | 418 | 300 | 196 | 674 |
| 2001 | 675 | 1,391 | 1,537 | 1,801 | 2,033 | 1,745 | 2,022 | 2,078 | 1,863 | 1,856 | 2,145 | 2,145 |
| 2002 | 2,121 | 2,098 | 2,190 | 1,713 | 2,069 | 1,528 | 1,671 | 1,920 | 1,662 | 2,316 | 2,312 | 2,408 |
| 2003 | 2,439 | 2,199 | 2,178 | 1,578 | 1,392 | 1,673 | 2,218 | 2,259 | 2,023 | 2,353 | 2,321 | 2,471 |
| 2004 | 2,572 | 2,550 | 2,481 | 2,068 | 2,423 | 2,237 | 2,370 | 2,369 | 2,270 | 2,142 | 2,553 | 2,535 |
| 2005 | 2,645 | 2,377 | 2,360 | 2,158 | 2,380 | 2,308 | 2,419 | 2,574 | 2,142 | 1,831 | 2,065 | 1,615 |
| 2006 | 2,312 | 2,104 | 2,177 | 2,321 | 2,340 | 2,193 | 2,193 | 2,088 | 1,902 | 2,226 | 2,314 | 2,420 |
| 2007 | 2,455 | 2,282 | 2,317 | 1,849 | 2,272 | 2,346 | 2,203 | 2,092 | 2,065 | 2,224 | 2,223 | 2,137 |
| 2008 | 2,450 | 2,260 | 2,333 | 2,221 | 2,481 | 2,182 | 2,300 | 2,133 | 2,234 | 1,513 | 1,203 | 1,088 |
| 2009 | 1,525 | 2,271 | 2,883 | 2,568 | 2,443 | 2,365 | 2,227 | 2,380 | 2,324 | 2,361 | 2,076 | 2,524 |
| 2010 | 2,556 | 2,462 | 2,660 | 2,499 | 2,351 | 2,396 | 2,662 | 2,622 | 2,409 | 2,633 | 2,622 | 2,670 |
| 2011 | 2,821 | 2,647 | 2,937 | 2,335 | 2,701 | 2,472 | 2,790 | 2,732 | 1,787 | 2,722 | 2,840 | 3,032 |
| 2012 | 3,089 | 2,807 | 2,889 | 2,779 | 3,112 | 2,423 | 2,068 | 2,848 | 2,519 | 2,089 | 2,165 | 2,398 |
| 2013 | 2,341 | 2,373 | 2,681 | 1,975 | 1,684 | 2,173 | 1,877 | 2,734 | 2,927 | 2,988 | 3,320 | 3,526 |
| 2014 | 3,052 | 2,357 | 3,503 | 3,639 | 3,617 | 4,892 | 4,755 | 4,551 | 4,666 | 4,645 | 4,514 | 4,826 |
| 2015 | 4,895 | 4,361 | 5,042 | 5,585 | 5,691 | 4,906 | 5,025 | 4,951 | 5,037 | 5,949 | 5,605 | 6,449 |
| 2016 | 5,882 | 5,624 | 6,436 | 6,222 | 6,641 | 6,165 | 5,709 | 5,236 | 5,571 | 4,855 | 6,003 | 5,910 |
| 2017 | 5,687 | 5,515 | 6,025 | 5,490 | 6,088 | 5,897 | 5,924 | 6,266 | 5,901 | 5,953 | 5,872 | 5,820 |
| 2018 | 6,213 | 5,678 | 5,329 | 5,851 | 6,230 | 4,830 | 5,460 | 5,663 | 6,064 | 5,326 | 5,288 | 5,893 |
| 2019 | 5,601 | 5,357 | 5,056 | 5,161 | 5,404 | 4,939 | 4,736 | 4,804 | 5,270 | 6,039 | 5,627 | 5,813 |
| 2020 | 5,632 | 4,596 | 5,379 | 4,369 | 5,142 | 5,037 | 5,251 | 5,236 | 4,928 | 4,764 | 5,227 | 5,685 |
| 2021 | 5,611 | 4,170 | 5,094 | 4,679 | 5,029 | 4,710 | 4,934 | 5,067 | 4,735 | 4,887 | 4,660 | 4,772 |
| 2022 | 5,153 | 4,436 | 5,172 | 4,714 | 5,266 | 5,299 | 5,119 | 5,156 | 4,951 | 5,099 | 5,393 | 4,611 |
| 2023 | 5,583 | 5,574 | 6,142 | 5,511 | 5,181 | 5,963 | 5,584 | 5,733 | 5,423 | 5,687 | 5,286 | 5,781 |
| 2024 | 5,527 | |||||||||||
| - = No Data Reported; -- = Not Applicable; NA = Not Available; W = Withheld to avoid disclosure of individual company data. |
| Release Date: 3/29/2024 |
| Next Release Date: 4/30/2024 |