|
Download Data (XLS File) |
|
||||||||
|
||||||||
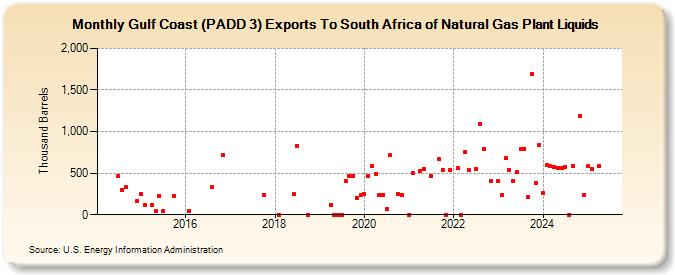
| Gulf Coast (PADD 3) Exports To South Africa of Natural Gas Plant Liquids (Thousand Barrels) | ||||||||
| Year | Jan | Feb | Mar | Apr | May | Jun | Jul | Aug | Sep | Oct | Nov | Dec |
|---|---|---|---|---|---|---|---|---|---|---|---|---|
| 2014 | 471 | 300 | 336 | 165 | ||||||||
| 2015 | 255 | 114 | 118 | 42 | 222 | 41 | 222 | |||||
| 2016 | 43 | 330 | 717 | |||||||||
| 2017 | 239 | |||||||||||
| 2018 | 0 | 250 | 827 | 0 | ||||||||
| 2019 | 120 | 0 | 0 | 0 | 406 | 469 | 467 | 205 | 240 | |||
| 2020 | 249 | 466 | 591 | 494 | 232 | 238 | 63 | 718 | 253 | 239 | ||
| 2021 | 0 | 496 | 524 | 554 | 468 | 665 | 541 | 0 | 537 | |||
| 2022 | 556 | 0 | 752 | 535 | 547 | 1,096 | 788 | 401 | ||||
| 2023 | 400 | 238 | 824 | 537 | 402 | 511 | 787 | 795 | 214 | 1,694 | 377 | 835 |
| 2024 | 259 | |||||||||||
| - = No Data Reported; -- = Not Applicable; NA = Not Available; W = Withheld to avoid disclosure of individual company data. |
| Release Date: 3/29/2024 |
| Next Release Date: 4/30/2024 |