|
Download Data (XLS File) |
|
||||||||
|
||||||||
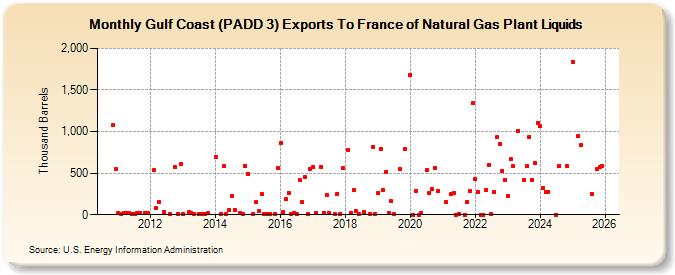
| Gulf Coast (PADD 3) Exports To France of Natural Gas Plant Liquids (Thousand Barrels) | ||||||||
| Year | Jan | Feb | Mar | Apr | May | Jun | Jul | Aug | Sep | Oct | Nov | Dec |
|---|---|---|---|---|---|---|---|---|---|---|---|---|
| 2010 | 1,075 | 550 | ||||||||||
| 2011 | 15 | 12 | 18 | 23 | 22 | 14 | 8 | 23 | 22 | 20 | 20 | |
| 2012 | 533 | 80 | 155 | 29 | 13 | 568 | 10 | 604 | ||||
| 2013 | 9 | 30 | 26 | 9 | 9 | 6 | 7 | 16 | ||||
| 2014 | 698 | 9 | 584 | 7 | 57 | 226 | 61 | 18 | 10 | 585 | ||
| 2015 | 493 | 9 | 147 | 45 | 245 | 9 | 9 | 8 | 9 | 567 | ||
| 2016 | 861 | 30 | 183 | 263 | 7 | 20 | 13 | 420 | 153 | 449 | 13 | 553 |
| 2017 | 574 | 23 | 570 | 26 | 239 | 19 | 7 | 252 | 7 | 560 | ||
| 2018 | 775 | 17 | 298 | 41 | 11 | 29 | 11 | 819 | 8 | |||
| 2019 | 260 | 789 | 294 | 518 | 22 | 161 | 11 | 548 | 787 | |||
| 2020 | 1,682 | 0 | 285 | 0 | 18 | 535 | 259 | 306 | 562 | 285 | ||
| 2021 | 153 | 250 | 262 | 0 | 8 | 0 | 156 | 282 | 1,341 | |||
| 2022 | 426 | 273 | 1 | 2 | 295 | 599 | 10 | 278 | 930 | 854 | 529 | 419 |
| 2023 | 221 | 664 | 587 | 1,007 | 415 | 584 | 937 | 418 | 620 | 1,099 | ||
| 2024 | 1,066 | 318 | 279 | 278 | ||||||||
| - = No Data Reported; -- = Not Applicable; NA = Not Available; W = Withheld to avoid disclosure of individual company data. |
| Release Date: 8/30/2024 |
| Next Release Date: 9/30/2024 |