|
Download Data (XLS File) |
|
||||||||
|
||||||||
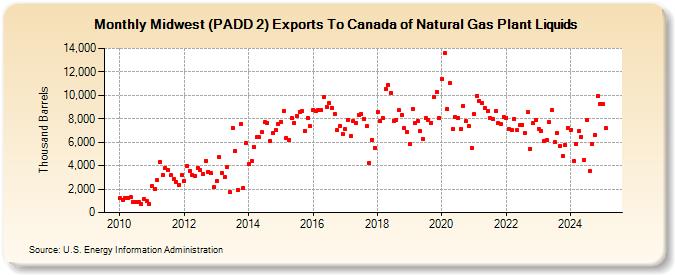
| Midwest (PADD 2) Exports To Canada of Natural Gas Plant Liquids (Thousand Barrels) | ||||||||
| Year | Jan | Feb | Mar | Apr | May | Jun | Jul | Aug | Sep | Oct | Nov | Dec |
|---|---|---|---|---|---|---|---|---|---|---|---|---|
| 2010 | 1,220 | 1,112 | 1,251 | 1,248 | 1,304 | 889 | 868 | 885 | 744 | 1,115 | 954 | 769 |
| 2011 | 2,285 | 2,047 | 2,750 | 4,341 | 3,213 | 3,786 | 3,643 | 3,164 | 2,850 | 2,602 | 2,336 | 3,213 |
| 2012 | 2,687 | 3,994 | 3,546 | 3,196 | 3,160 | 3,813 | 3,609 | 3,299 | 4,427 | 3,498 | 3,344 | 2,153 |
| 2013 | 2,669 | 4,713 | 3,385 | 3,004 | 3,924 | 1,744 | 7,236 | 5,274 | 1,959 | 7,545 | 2,116 | 5,896 |
| 2014 | 4,128 | 4,392 | 5,596 | 6,405 | 6,426 | 6,840 | 7,681 | 7,654 | 6,101 | 6,764 | 7,026 | 7,584 |
| 2015 | 7,747 | 8,648 | 6,383 | 6,190 | 8,026 | 7,650 | 8,246 | 8,605 | 8,627 | 6,960 | 8,072 | 7,348 |
| 2016 | 8,783 | 8,625 | 8,730 | 8,787 | 9,841 | 8,988 | 9,362 | 8,948 | 8,422 | 7,005 | 7,423 | 6,729 |
| 2017 | 7,124 | 7,911 | 6,545 | 7,828 | 7,676 | 8,310 | 8,400 | 8,021 | 7,345 | 4,233 | 6,216 | 5,546 |
| 2018 | 8,575 | 7,774 | 8,066 | 10,556 | 10,897 | 10,209 | 7,831 | 7,926 | 8,711 | 8,362 | 7,182 | 6,857 |
| 2019 | 5,820 | 8,839 | 7,624 | 7,811 | 6,955 | 6,314 | 8,036 | 7,925 | 7,679 | 9,870 | 10,318 | 8,035 |
| 2020 | 11,432 | 13,580 | 8,863 | 11,049 | 7,144 | 8,136 | 8,080 | 7,131 | 9,106 | 7,796 | 7,401 | 5,525 |
| 2021 | 8,390 | 9,975 | 9,523 | 9,324 | 8,923 | 8,636 | 8,050 | 7,978 | 8,670 | 7,620 | 7,560 | 8,169 |
| 2022 | 8,101 | 7,109 | 7,011 | 7,992 | 7,000 | 7,436 | 7,495 | 6,759 | 8,550 | 5,460 | 7,652 | 7,890 |
| 2023 | 6,978 | 6,524 | 6,018 | 6,246 | 3,971 | 5,450 | 3,925 | 3,921 | 3,295 | 2,425 | 5,703 | 7,097 |
| 2024 | 7,074 | |||||||||||
| - = No Data Reported; -- = Not Applicable; NA = Not Available; W = Withheld to avoid disclosure of individual company data. |
| Release Date: 3/29/2024 |
| Next Release Date: 4/30/2024 |