|
Download Data (XLS File) |
|
||||||||
|
||||||||
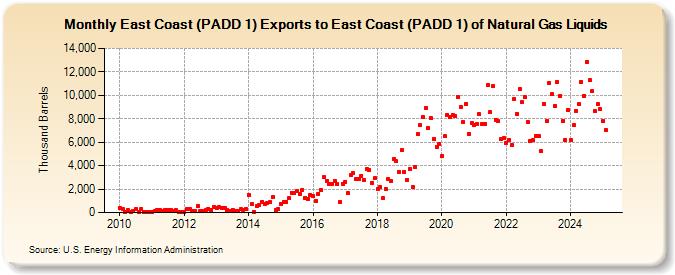
| East Coast (PADD 1) Exports to East Coast (PADD 1) of Natural Gas Liquids (Thousand Barrels) | ||||||||
| Year | Jan | Feb | Mar | Apr | May | Jun | Jul | Aug | Sep | Oct | Nov | Dec |
|---|---|---|---|---|---|---|---|---|---|---|---|---|
| 2010 | 386 | 291 | 52 | 183 | 31 | 92 | 278 | 48 | 299 | 22 | 34 | 24 |
| 2011 | 57 | 158 | 235 | 193 | 141 | 212 | 216 | 207 | 104 | 180 | 41 | 33 |
| 2012 | 53 | 323 | 278 | 170 | 154 | 547 | 175 | 115 | 202 | 344 | 189 | 502 |
| 2013 | 369 | 434 | 392 | 397 | 201 | 129 | 225 | 142 | 168 | 280 | 260 | 341 |
| 2014 | 1,533 | 737 | 79 | 552 | 648 | 939 | 746 | 840 | 891 | 1,326 | 260 | 315 |
| 2015 | 733 | 927 | 930 | 1,238 | 1,696 | 1,652 | 1,877 | 1,566 | 1,928 | 1,282 | 1,137 | 1,519 |
| 2016 | 1,408 | 1,017 | 1,624 | 1,933 | 3,029 | 2,714 | 2,478 | 2,472 | 2,675 | 2,417 | 914 | 2,470 |
| 2017 | 2,638 | 1,626 | 3,174 | 3,348 | 2,898 | 2,829 | 3,144 | 2,773 | 3,677 | 3,617 | 2,545 | 2,919 |
| 2018 | 2,017 | 2,179 | 1,202 | 2,017 | 2,894 | 2,679 | 4,542 | 4,358 | 3,492 | 5,321 | 3,451 | 2,791 |
| 2019 | 3,746 | 2,164 | 3,847 | 6,684 | 7,463 | 8,162 | 8,920 | 7,196 | 8,041 | 6,315 | 5,612 | 5,816 |
| 2020 | 4,831 | 6,507 | 8,302 | 8,143 | 8,357 | 8,220 | 9,853 | 9,025 | 7,723 | 9,287 | 6,715 | 7,623 |
| 2021 | 7,465 | 7,557 | 8,381 | 7,578 | 7,519 | 10,843 | 8,549 | 10,760 | 7,913 | 7,824 | 6,234 | 6,316 |
| 2022 | 5,934 | 6,220 | 5,775 | 9,721 | 8,439 | 10,546 | 9,419 | 9,819 | 7,726 | 6,063 | 6,151 | 6,548 |
| 2023 | 7,019 | 5,463 | 8,545 | 8,411 | 10,581 | 9,570 | 9,013 | 11,243 | 10,240 | 7,825 | 6,153 | 9,140 |
| 2024 | 6,207 | |||||||||||
| - = No Data Reported; -- = Not Applicable; NA = Not Available; W = Withheld to avoid disclosure of individual company data. |
| Release Date: 3/29/2024 |
| Next Release Date: 4/30/2024 |