|
Download Data (XLS File) |
|
||||||||
|
||||||||
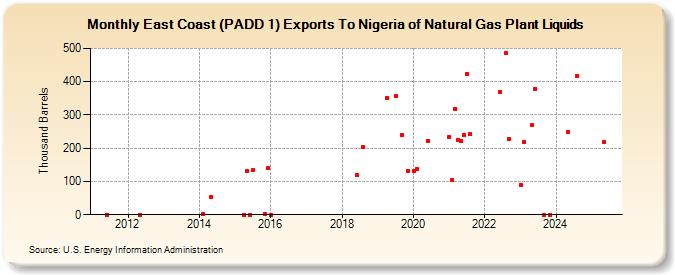
| East Coast (PADD 1) Exports To Nigeria of Natural Gas Plant Liquids (Thousand Barrels) | ||||||||
| Year | Jan | Feb | Mar | Apr | May | Jun | Jul | Aug | Sep | Oct | Nov | Dec |
|---|---|---|---|---|---|---|---|---|---|---|---|---|
| 2011 | 0 | |||||||||||
| 2012 | 0 | |||||||||||
| 2014 | 1 | 53 | ||||||||||
| 2015 | 0 | 131 | 0 | 134 | 3 | 141 | ||||||
| 2016 | 0 | |||||||||||
| 2018 | 118 | 205 | ||||||||||
| 2019 | 351 | 357 | 240 | 132 | ||||||||
| 2020 | 130 | 138 | 223 | |||||||||
| 2021 | 235 | 103 | 319 | 226 | 223 | 240 | 423 | 242 | ||||
| 2022 | 369 | 486 | 228 | |||||||||
| 2023 | 89 | 218 | 270 | 379 | 0 | 0 | ||||||
| - = No Data Reported; -- = Not Applicable; NA = Not Available; W = Withheld to avoid disclosure of individual company data. |
| Release Date: 3/29/2024 |
| Next Release Date: 4/30/2024 |