|
Download Data (XLS File) |
|
||||||||
|
||||||||
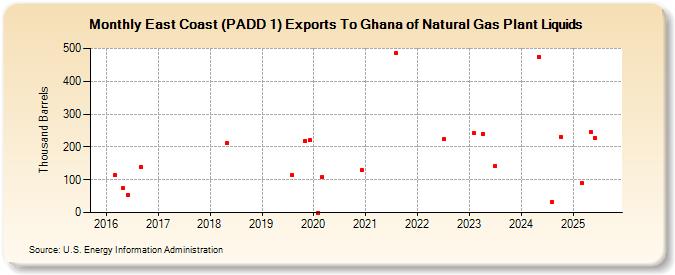
| East Coast (PADD 1) Exports To Ghana of Natural Gas Plant Liquids (Thousand Barrels) | ||||||||
| Year | Jan | Feb | Mar | Apr | May | Jun | Jul | Aug | Sep | Oct | Nov | Dec |
|---|---|---|---|---|---|---|---|---|---|---|---|---|
| 2016 | 113 | 74 | 53 | 140 | ||||||||
| 2018 | 211 | |||||||||||
| 2019 | 114 | 219 | 220 | |||||||||
| 2020 | 0 | 109 | 130 | |||||||||
| 2021 | 486 | |||||||||||
| 2022 | 224 | |||||||||||
| 2023 | 242 | 239 | 142 | |||||||||
| - = No Data Reported; -- = Not Applicable; NA = Not Available; W = Withheld to avoid disclosure of individual company data. |
| Release Date: 3/29/2024 |
| Next Release Date: 4/30/2024 |