|
Download Data (XLS File) |
|
||||||||
|
||||||||
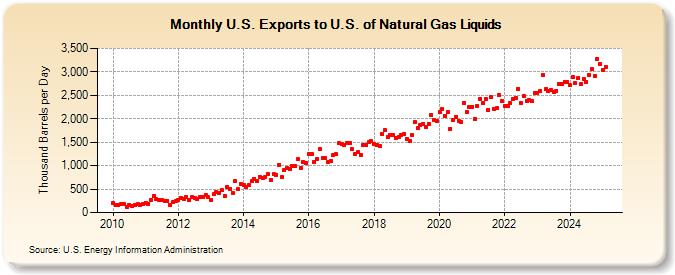
| U.S. Exports to U.S. of Natural Gas Liquids (Thousand Barrels per Day) | ||||||||
| Year | Jan | Feb | Mar | Apr | May | Jun | Jul | Aug | Sep | Oct | Nov | Dec |
|---|---|---|---|---|---|---|---|---|---|---|---|---|
| 2010 | 194 | 157 | 155 | 176 | 176 | 125 | 170 | 132 | 155 | 172 | 164 | 190 |
| 2011 | 213 | 192 | 270 | 348 | 292 | 276 | 262 | 253 | 256 | 168 | 217 | 242 |
| 2012 | 268 | 316 | 297 | 326 | 270 | 325 | 321 | 290 | 327 | 331 | 379 | 326 |
| 2013 | 278 | 389 | 431 | 415 | 471 | 351 | 555 | 504 | 426 | 672 | 496 | 619 |
| 2014 | 597 | 550 | 590 | 672 | 722 | 672 | 768 | 742 | 762 | 825 | 702 | 819 |
| 2015 | 808 | 1,021 | 752 | 909 | 952 | 932 | 1,003 | 991 | 1,136 | 953 | 1,080 | 1,067 |
| 2016 | 1,245 | 1,239 | 1,088 | 1,150 | 1,345 | 1,173 | 1,161 | 1,074 | 1,102 | 1,233 | 1,246 | 1,477 |
| 2017 | 1,456 | 1,441 | 1,486 | 1,478 | 1,347 | 1,249 | 1,282 | 1,232 | 1,442 | 1,431 | 1,495 | 1,515 |
| 2018 | 1,456 | 1,436 | 1,427 | 1,670 | 1,753 | 1,619 | 1,663 | 1,660 | 1,582 | 1,614 | 1,659 | 1,671 |
| 2019 | 1,561 | 1,517 | 1,652 | 1,923 | 1,802 | 1,860 | 1,893 | 1,832 | 1,885 | 2,081 | 1,981 | 1,955 |
| 2020 | 2,136 | 2,204 | 2,068 | 2,140 | 1,790 | 1,968 | 2,043 | 1,953 | 1,934 | 2,337 | 2,154 | 2,246 |
| 2021 | 2,261 | 2,004 | 2,269 | 2,424 | 2,340 | 2,428 | 2,182 | 2,458 | 2,218 | 2,229 | 2,499 | 2,377 |
| 2022 | 2,267 | 2,269 | 2,328 | 2,421 | 2,449 | 2,643 | 2,339 | 2,478 | 2,381 | 2,402 | 2,372 | 2,556 |
| 2023 | 2,565 | 2,646 | 2,841 | 2,619 | 2,413 | 2,528 | 2,501 | 2,513 | 2,682 | 2,658 | 2,807 | 2,816 |
| 2024 | 2,714 | |||||||||||
| - = No Data Reported; -- = Not Applicable; NA = Not Available; W = Withheld to avoid disclosure of individual company data. |
| Release Date: 3/29/2024 |
| Next Release Date: 4/30/2024 |