|
Download Data (XLS File) |
|
||||||||
|
||||||||
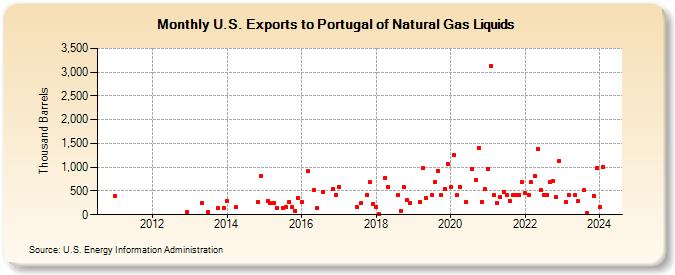
| U.S. Exports to Portugal of Natural Gas Liquids (Thousand Barrels) | ||||||||
| Year | Jan | Feb | Mar | Apr | May | Jun | Jul | Aug | Sep | Oct | Nov | Dec |
|---|---|---|---|---|---|---|---|---|---|---|---|---|
| 2011 | 388 | |||||||||||
| 2012 | 51 | |||||||||||
| 2013 | 250 | 54 | 134 | 134 | ||||||||
| 2014 | 283 | 155 | 267 | 817 | ||||||||
| 2015 | 286 | 241 | 247 | 137 | 145 | 152 | 275 | 153 | 81 | 362 | ||
| 2016 | 267 | 911 | 523 | 131 | 477 | 550 | 417 | |||||
| 2017 | 584 | 158 | 245 | 418 | 682 | 233 | ||||||
| 2018 | 161 | 7 | 781 | 585 | 414 | 88 | 576 | 306 | 247 | |||
| 2019 | 275 | 981 | 354 | 416 | 681 | 923 | 413 | 550 | 1,064 | |||
| 2020 | 573 | 1,253 | 413 | 587 | 275 | 962 | 721 | 1,410 | 269 | 534 | ||
| 2021 | 965 | 3,128 | 414 | 246 | 379 | 475 | 412 | 296 | 420 | 413 | 414 | 686 |
| 2022 | 450 | 414 | 687 | 810 | 1,381 | 513 | 420 | 420 | 685 | 717 | 370 | 1,131 |
| 2023 | 265 | 414 | 407 | 283 | 520 | 33 | 402 | 977 | ||||
| 2024 | 157 | |||||||||||
| - = No Data Reported; -- = Not Applicable; NA = Not Available; W = Withheld to avoid disclosure of individual company data. |
| Release Date: 3/29/2024 |
| Next Release Date: 4/30/2024 |