|
Download Data (XLS File) |
|
||||||||
|
||||||||
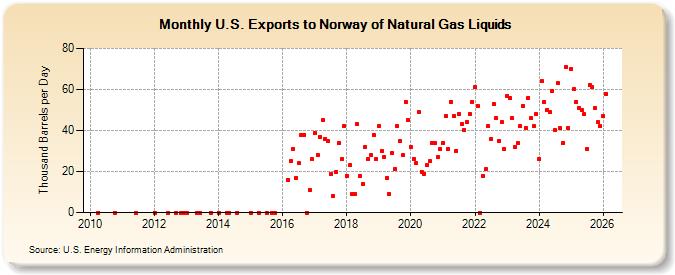
| U.S. Exports to Norway of Natural Gas Liquids (Thousand Barrels per Day) | ||||||||
| Year | Jan | Feb | Mar | Apr | May | Jun | Jul | Aug | Sep | Oct | Nov | Dec |
|---|---|---|---|---|---|---|---|---|---|---|---|---|
| 2010 | 0 | 0 | ||||||||||
| 2011 | 0 | |||||||||||
| 2012 | 0 | 0 | 0 | 0 | 0 | |||||||
| 2013 | 0 | 0 | 0 | 0 | ||||||||
| 2014 | 0 | 0 | 0 | 0 | ||||||||
| 2015 | 0 | 0 | 0 | 0 | 0 | |||||||
| 2016 | 16 | 25 | 31 | 17 | 24 | 38 | 38 | 0 | 11 | 26 | ||
| 2017 | 39 | 28 | 37 | 45 | 36 | 35 | 19 | 8 | 20 | 34 | 26 | 42 |
| 2018 | 18 | 23 | 9 | 9 | 43 | 18 | 14 | 32 | 26 | 28 | 38 | 26 |
| 2019 | 42 | 30 | 27 | 17 | 9 | 29 | 21 | 42 | 35 | 28 | 54 | 45 |
| 2020 | 32 | 26 | 24 | 49 | 20 | 19 | 23 | 25 | 34 | 34 | 27 | 31 |
| 2021 | 34 | 47 | 31 | 54 | 47 | 30 | 48 | 43 | 40 | 44 | 48 | 54 |
| 2022 | 61 | 52 | 0 | 18 | 21 | 42 | 36 | 53 | 46 | 35 | 44 | 31 |
| 2023 | 57 | 56 | 49 | 32 | 34 | 42 | 52 | 41 | 56 | 42 | 42 | 48 |
| 2024 | 26 | 55 | 54 | 50 | ||||||||
| - = No Data Reported; -- = Not Applicable; NA = Not Available; W = Withheld to avoid disclosure of individual company data. |
| Release Date: 6/28/2024 |
| Next Release Date: 7/31/2024 |