|
Download Data (XLS File) |
|
||||||||
|
||||||||
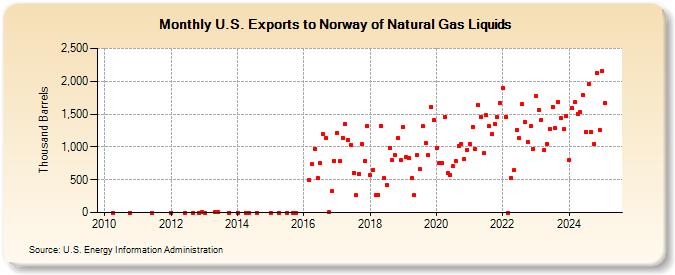
| U.S. Exports to Norway of Natural Gas Liquids (Thousand Barrels) | ||||||||
| Year | Jan | Feb | Mar | Apr | May | Jun | Jul | Aug | Sep | Oct | Nov | Dec |
|---|---|---|---|---|---|---|---|---|---|---|---|---|
| 2010 | 0 | 0 | ||||||||||
| 2011 | 0 | |||||||||||
| 2012 | 0 | 0 | 0 | 0 | 1 | |||||||
| 2013 | 0 | 1 | 2 | 0 | ||||||||
| 2014 | 0 | 0 | 0 | 0 | ||||||||
| 2015 | 0 | 0 | 0 | 0 | 0 | |||||||
| 2016 | 497 | 736 | 975 | 522 | 752 | 1,189 | 1,136 | 4 | 321 | 792 | ||
| 2017 | 1,219 | 782 | 1,138 | 1,342 | 1,103 | 1,036 | 604 | 262 | 590 | 1,043 | 790 | 1,313 |
| 2018 | 565 | 644 | 264 | 261 | 1,323 | 527 | 423 | 987 | 793 | 869 | 1,134 | 793 |
| 2019 | 1,308 | 845 | 830 | 519 | 265 | 883 | 658 | 1,312 | 1,054 | 872 | 1,609 | 1,404 |
| 2020 | 978 | 752 | 752 | 1,456 | 609 | 572 | 705 | 787 | 1,012 | 1,050 | 814 | 958 |
| 2021 | 1,039 | 1,303 | 966 | 1,635 | 1,462 | 903 | 1,481 | 1,321 | 1,189 | 1,350 | 1,449 | 1,668 |
| 2022 | 1,890 | 1,453 | 0 | 529 | 643 | 1,260 | 1,130 | 1,649 | 1,380 | 1,082 | 1,312 | 970 |
| 2023 | 1,769 | 1,561 | 1,523 | 947 | 1,051 | 1,272 | 1,611 | 1,283 | 1,690 | 1,299 | 1,274 | 1,474 |
| 2024 | 801 | |||||||||||
| - = No Data Reported; -- = Not Applicable; NA = Not Available; W = Withheld to avoid disclosure of individual company data. |
| Release Date: 3/29/2024 |
| Next Release Date: 4/30/2024 |