|
Download Data (XLS File) |
|
||||||||
|
||||||||
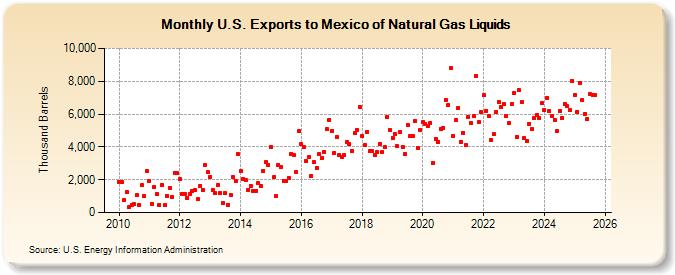
| U.S. Exports to Mexico of Natural Gas Liquids (Thousand Barrels) | ||||||||
| Year | Jan | Feb | Mar | Apr | May | Jun | Jul | Aug | Sep | Oct | Nov | Dec |
|---|---|---|---|---|---|---|---|---|---|---|---|---|
| 2010 | 1,891 | 1,862 | 765 | 1,238 | 319 | 486 | 512 | 1,064 | 474 | 1,652 | 980 | 2,544 |
| 2011 | 1,950 | 525 | 1,562 | 1,120 | 488 | 1,698 | 440 | 1,028 | 1,516 | 945 | 2,410 | 2,382 |
| 2012 | 2,037 | 1,105 | 1,115 | 912 | 1,121 | 1,321 | 1,364 | 800 | 1,639 | 1,389 | 2,877 | 2,442 |
| 2013 | 2,184 | 1,375 | 1,167 | 1,687 | 1,189 | 590 | 1,172 | 479 | 1,070 | 2,155 | 1,951 | 3,562 |
| 2014 | 2,517 | 2,063 | 1,969 | 1,399 | 1,626 | 1,339 | 1,332 | 1,786 | 1,626 | 2,554 | 3,054 | 2,882 |
| 2015 | 3,972 | 2,137 | 987 | 2,908 | 2,779 | 1,925 | 1,930 | 2,117 | 3,591 | 3,531 | 2,488 | 4,983 |
| 2016 | 4,146 | 3,968 | 3,138 | 3,389 | 2,254 | 3,077 | 2,731 | 3,549 | 3,319 | 3,689 | 5,083 | 5,640 |
| 2017 | 4,982 | 3,636 | 4,616 | 3,501 | 3,376 | 3,517 | 4,304 | 4,176 | 3,756 | 4,846 | 5,046 | 6,434 |
| 2018 | 4,689 | 4,128 | 4,915 | 3,732 | 3,728 | 3,517 | 3,662 | 4,185 | 3,685 | 3,980 | 5,820 | 5,043 |
| 2019 | 4,546 | 4,759 | 4,038 | 4,928 | 3,986 | 3,578 | 5,354 | 4,667 | 4,689 | 5,584 | 3,934 | 5,046 |
| 2020 | 5,519 | 5,406 | 5,293 | 5,471 | 3,048 | 4,504 | 4,327 | 5,096 | 5,172 | 6,869 | 6,570 | 8,816 |
| 2021 | 4,692 | 5,625 | 6,369 | 4,285 | 4,868 | 4,111 | 5,848 | 5,449 | 5,891 | 8,327 | 5,491 | 6,136 |
| 2022 | 7,140 | 6,208 | 5,883 | 4,440 | 4,782 | 6,132 | 6,747 | 6,452 | 6,604 | 5,905 | 5,479 | 6,588 |
| 2023 | 6,990 | 4,775 | 8,364 | 6,048 | 4,508 | 4,359 | 5,459 | 5,086 | 5,769 | 5,964 | 5,750 | 6,647 |
| 2024 | 6,236 | |||||||||||
| - = No Data Reported; -- = Not Applicable; NA = Not Available; W = Withheld to avoid disclosure of individual company data. |
| Release Date: 3/29/2024 |
| Next Release Date: 4/30/2024 |