|
Download Data (XLS File) |
|
||||||||
|
||||||||
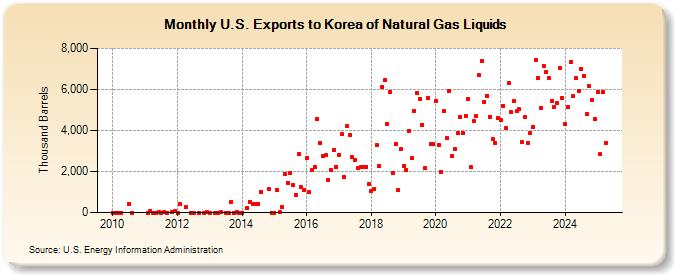
| U.S. Exports to Korea of Natural Gas Liquids (Thousand Barrels) | ||||||||
| Year | Jan | Feb | Mar | Apr | May | Jun | Jul | Aug | Sep | Oct | Nov | Dec |
|---|---|---|---|---|---|---|---|---|---|---|---|---|
| 2010 | 1 | 1 | 0 | 1 | 434 | 1 | ||||||
| 2011 | 0 | 73 | 1 | 2 | 15 | 1 | 8 | 0 | 7 | 62 | ||
| 2012 | 0 | 400 | 260 | 1 | 0 | 0 | 1 | 3 | ||||
| 2013 | 2 | 1 | 1 | 3 | 1 | 0 | 527 | 0 | 3 | 0 | ||
| 2014 | 0 | 228 | 526 | 430 | 430 | 410 | 1,012 | 1,155 | 2 | |||
| 2015 | 0 | 1,123 | 3 | 265 | 1,882 | 1,455 | 1,912 | 1,340 | 873 | 2,840 | 1,229 | 1,084 |
| 2016 | 2,671 | 980 | 2,077 | 2,236 | 4,579 | 3,374 | 2,775 | 2,783 | 1,589 | 2,063 | 3,070 | 2,226 |
| 2017 | 2,818 | 3,808 | 1,710 | 4,200 | 3,800 | 2,693 | 2,566 | 2,191 | 2,205 | 2,216 | 2,243 | 1,373 |
| 2018 | 1,058 | 1,141 | 3,292 | 2,245 | 6,115 | 6,446 | 4,307 | 5,876 | 1,929 | 3,318 | 1,095 | 3,084 |
| 2019 | 2,266 | 2,084 | 3,997 | 2,676 | 4,939 | 5,819 | 5,539 | 4,278 | 2,175 | 5,594 | 3,337 | 3,327 |
| 2020 | 5,434 | 3,316 | 1,994 | 4,925 | 3,619 | 5,935 | 2,734 | 3,077 | 3,854 | 4,639 | 3,857 | 4,701 |
| 2021 | 5,558 | 2,204 | 4,456 | 4,691 | 6,691 | 7,390 | 5,410 | 5,696 | 4,662 | 3,582 | 3,367 | 4,599 |
| 2022 | 4,527 | 5,204 | 4,100 | 6,326 | 4,887 | 5,416 | 4,928 | 5,030 | 3,434 | 4,635 | 3,410 | 3,854 |
| 2023 | 3,062 | 6,867 | 5,453 | 5,000 | 6,854 | 6,092 | 5,187 | 4,885 | 3,952 | 4,149 | 5,351 | 5,618 |
| 2024 | 4,296 | |||||||||||
| - = No Data Reported; -- = Not Applicable; NA = Not Available; W = Withheld to avoid disclosure of individual company data. |
| Release Date: 3/29/2024 |
| Next Release Date: 4/30/2024 |