|
Download Data (XLS File) |
|
||||||||
|
||||||||
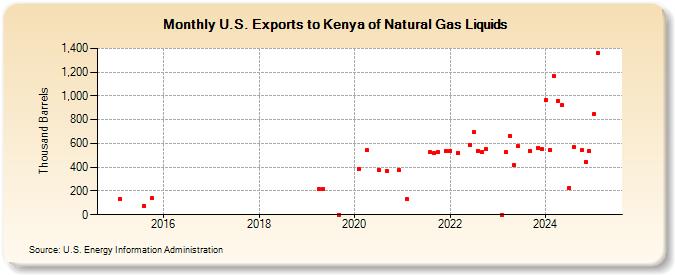
| U.S. Exports to Kenya of Natural Gas Liquids (Thousand Barrels) | ||||||||
| Year | Jan | Feb | Mar | Apr | May | Jun | Jul | Aug | Sep | Oct | Nov | Dec |
|---|---|---|---|---|---|---|---|---|---|---|---|---|
| 2015 | 130 | 77 | 138 | |||||||||
| 2019 | 213 | 217 | 0 | |||||||||
| 2020 | 385 | 542 | 377 | 372 | 374 | |||||||
| 2021 | 132 | 526 | 518 | 528 | 537 | |||||||
| 2022 | 540 | 522 | 587 | 694 | 539 | 530 | 550 | |||||
| 2023 | 525 | 665 | 418 | 599 | 539 | 562 | 554 | |||||
| 2024 | 964 | |||||||||||
| - = No Data Reported; -- = Not Applicable; NA = Not Available; W = Withheld to avoid disclosure of individual company data. |
| Release Date: 3/29/2024 |
| Next Release Date: 4/30/2024 |