|
Download Data (XLS File) |
|
||||||||
|
||||||||
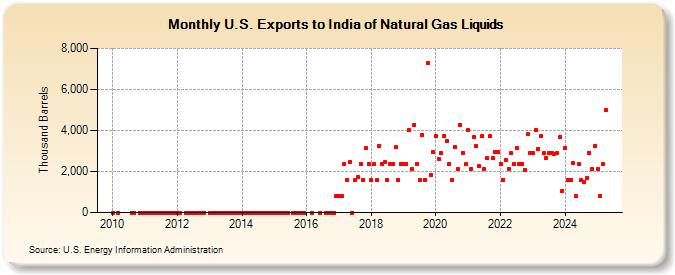
| U.S. Exports to India of Natural Gas Liquids (Thousand Barrels) | ||||||||
| Year | Jan | Feb | Mar | Apr | May | Jun | Jul | Aug | Sep | Oct | Nov | Dec |
|---|---|---|---|---|---|---|---|---|---|---|---|---|
| 2010 | 0 | 0 | 0 | 0 | 0 | 0 | ||||||
| 2011 | 0 | 1 | 0 | 0 | 0 | 0 | 1 | 0 | 0 | 0 | 0 | 2 |
| 2012 | 0 | 0 | 0 | 1 | 0 | 0 | 0 | 0 | 0 | 0 | ||
| 2013 | 0 | 1 | 0 | 0 | 1 | 0 | 0 | 0 | 0 | 0 | 1 | 0 |
| 2014 | 0 | 0 | 0 | 0 | 1 | 1 | 0 | 1 | 0 | 0 | 0 | 0 |
| 2015 | 0 | 0 | 0 | 0 | 0 | 0 | 0 | 0 | 0 | 0 | 0 | |
| 2016 | 0 | 0 | 0 | 0 | 1 | 0 | 825 | |||||
| 2017 | 790 | 790 | 2,374 | 1,578 | 2,472 | 0 | 1,585 | 1,741 | 2,379 | 1,587 | 3,169 | 2,376 |
| 2018 | 1,584 | 2,375 | 1,584 | 3,234 | 2,374 | 2,440 | 1,586 | 2,379 | 2,378 | 3,174 | 1,586 | 2,379 |
| 2019 | 2,377 | 2,379 | 4,023 | 2,120 | 4,273 | 2,382 | 1,584 | 3,780 | 1,587 | 7,303 | 1,826 | 2,932 |
| 2020 | 3,725 | 2,632 | 2,909 | 3,745 | 3,478 | 2,378 | 1,587 | 3,176 | 2,130 | 4,287 | 2,919 | 2,346 |
| 2021 | 4,022 | 2,110 | 3,666 | 3,224 | 2,261 | 3,722 | 2,116 | 2,651 | 3,717 | 2,647 | 2,946 | 2,931 |
| 2022 | 2,385 | 1,598 | 2,585 | 2,139 | 2,879 | 2,382 | 3,169 | 2,371 | 2,378 | 2,090 | 3,811 | 2,915 |
| 2023 | 2,901 | 4,018 | 3,093 | 3,709 | 2,897 | 2,647 | 2,894 | 2,918 | 2,869 | 2,903 | 3,694 | 1,059 |
| 2024 | 3,163 | 1,590 | 1,585 | 2,400 | 796 | 2,379 | 1,582 | 1,485 | 1,676 | 2,924 | 2,120 | 3,255 |
| 2025 | 2,120 | 794 | 2,374 | 4,992 | ||||||||
| - = No Data Reported; -- = Not Applicable; NA = Not Available; W = Withheld to avoid disclosure of individual company data. |
| Release Date: 6/30/2025 |
| Next Release Date: 7/31/2025 |