|
Download Data (XLS File) |
|
||||||||
|
||||||||
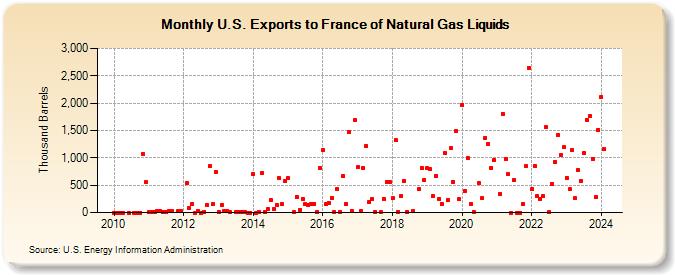
| U.S. Exports to France of Natural Gas Liquids (Thousand Barrels) | ||||||||
| Year | Jan | Feb | Mar | Apr | May | Jun | Jul | Aug | Sep | Oct | Nov | Dec |
|---|---|---|---|---|---|---|---|---|---|---|---|---|
| 2010 | 0 | 0 | 0 | 0 | 0 | 0 | 0 | 0 | 1,075 | 550 | ||
| 2011 | 15 | 12 | 18 | 23 | 22 | 14 | 8 | 24 | 23 | 20 | 20 | |
| 2012 | 533 | 80 | 155 | 0 | 29 | 1 | 14 | 141 | 847 | 151 | 745 | |
| 2013 | 9 | 142 | 30 | 26 | 9 | 9 | 6 | 7 | 16 | 0 | 0 | |
| 2014 | 698 | 0 | 9 | 719 | 7 | 57 | 226 | 61 | 143 | 625 | 148 | 585 |
| 2015 | 629 | 9 | 292 | 45 | 245 | 149 | 139 | 148 | 158 | 9 | 812 | |
| 2016 | 1,137 | 153 | 183 | 263 | 7 | 429 | 13 | 669 | 153 | 1,475 | 31 | 1,691 |
| 2017 | 824 | 23 | 812 | 1,218 | 189 | 239 | 19 | 7 | 252 | 557 | 560 | |
| 2018 | 262 | 1,325 | 17 | 298 | 577 | 11 | 29 | 426 | 819 | 591 | ||
| 2019 | 810 | 789 | 295 | 674 | 245 | 161 | 1,088 | 223 | 1,173 | 561 | 1,482 | 241 |
| 2020 | 1,972 | 397 | 992 | 155 | 18 | 535 | 260 | 1,367 | 1,253 | 820 | 968 | |
| 2021 | 335 | 1,806 | 983 | 696 | 0 | 593 | 0 | 0 | 156 | 844 | 2,645 | |
| 2022 | 426 | 848 | 297 | 243 | 295 | 1,556 | 10 | 520 | 930 | 1,424 | 1,056 | 1,191 |
| 2023 | 637 | 423 | 1,141 | 259 | 781 | 580 | 1,088 | 1,699 | 1,762 | 987 | 281 | 1,513 |
| 2024 | 2,116 | 1,165 | 818 | 949 | ||||||||
| - = No Data Reported; -- = Not Applicable; NA = Not Available; W = Withheld to avoid disclosure of individual company data. |
| Release Date: 6/28/2024 |
| Next Release Date: 7/31/2024 |